Designing Simulink model for RC Circuit
References for Waijung2 Model-Base Design & Hardware-In-the-Loop (HIL) Simulation
Waijung2 Model-Based Design & Internet of Things tutorials for ESP32
External mode simulation (HIL Simulation)
Hardware in the Loop Simulation Example
Use Time Constant
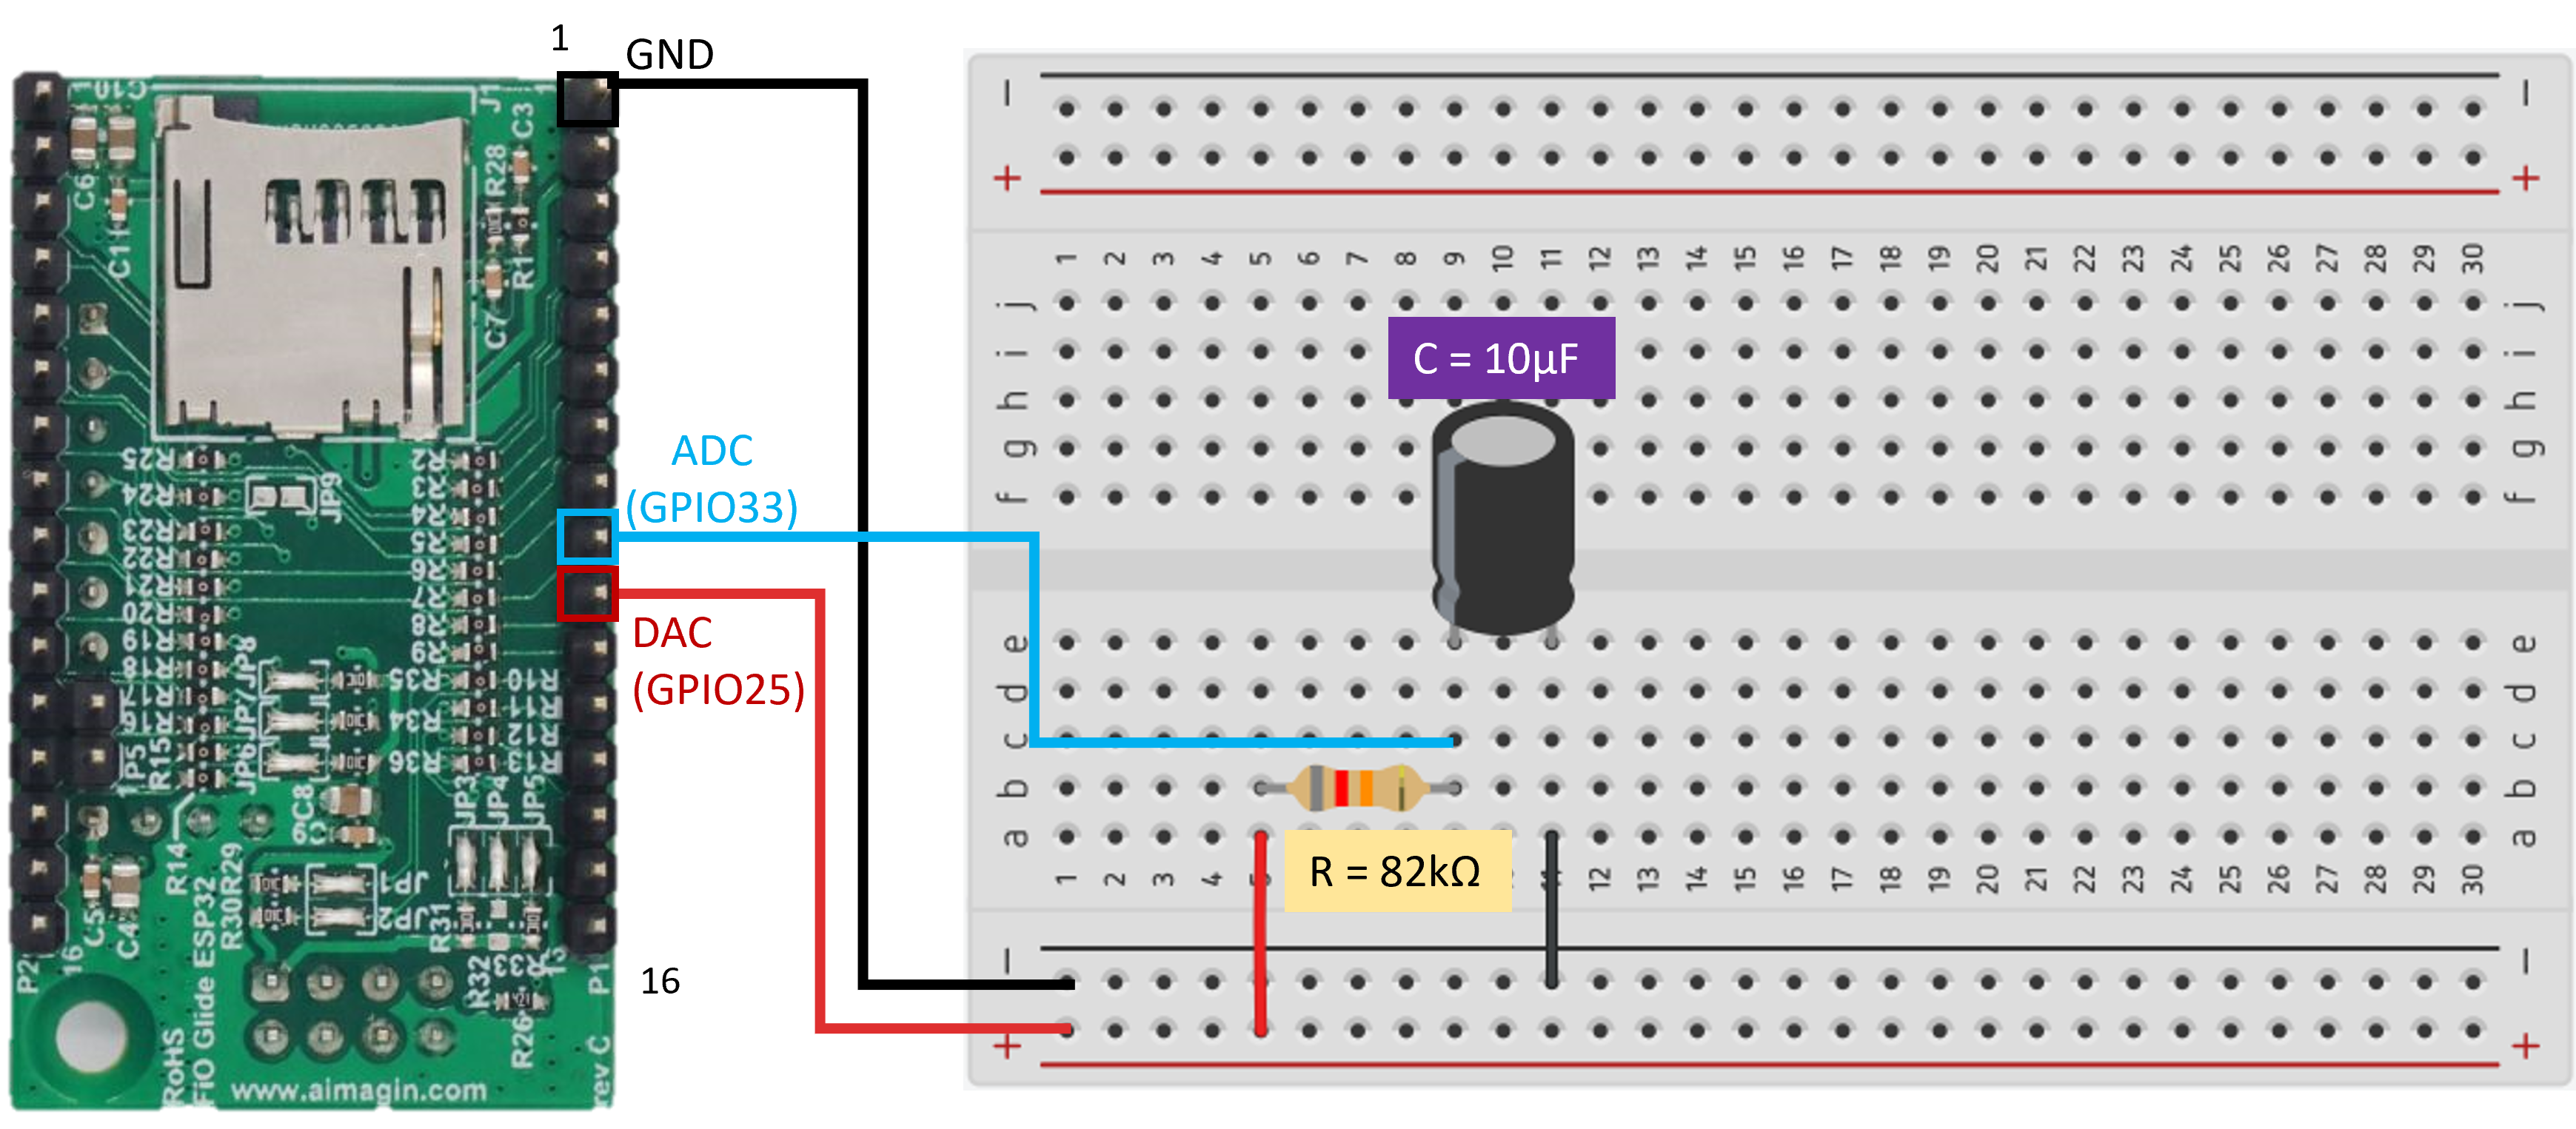
Figure 8: Wiring Connections between an RC Circuit and aMG FiO Glide ESP32
Step 1: Create the Simulink model
Use following blocks:
•For Input : Pulse Genearator
•Waijung 2 blocks : Target Setup,DAC,ADC
•Data Conversion: Gain
•For Output : Scope
Simulink Model: rc_hil.slx
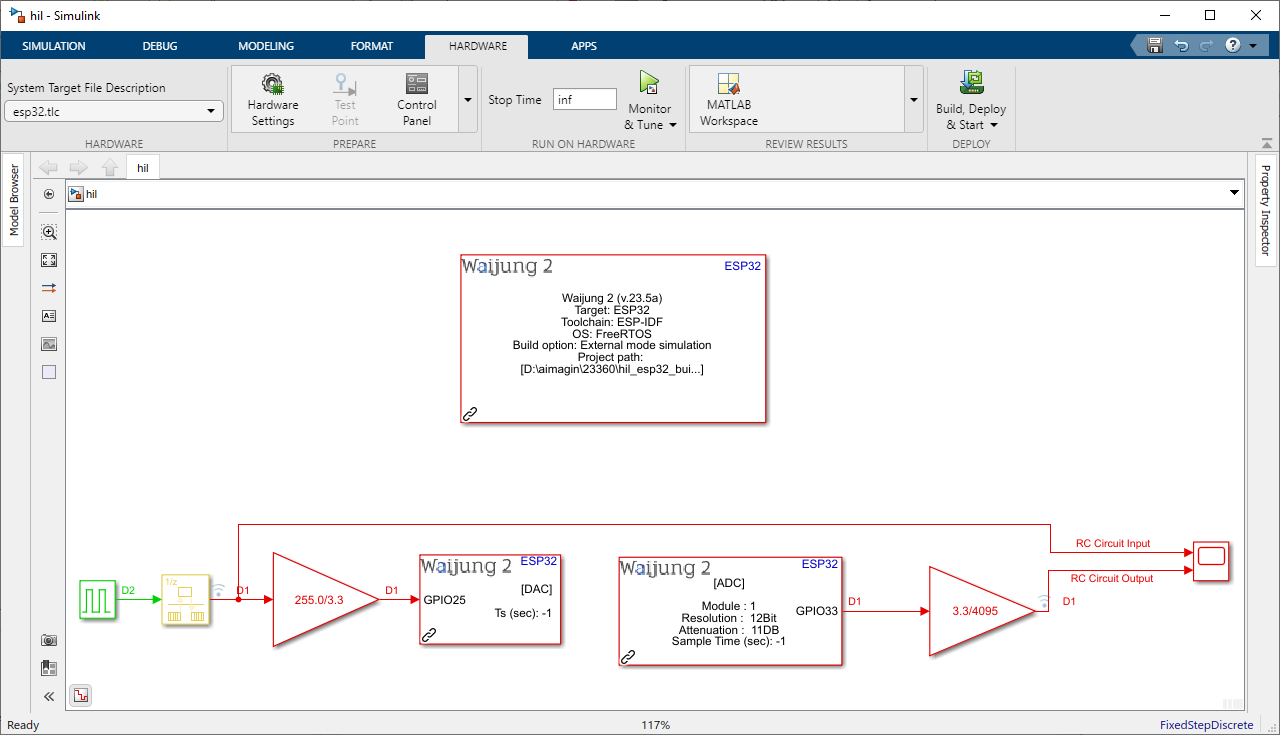
Figure 9: Simulink Hardware-in-the-Loop (HIL) Model of the RC Circuit (Plant Only)
Step 2: Run Simulation and Open Scope for the results
Reference: How to run HIL simulation
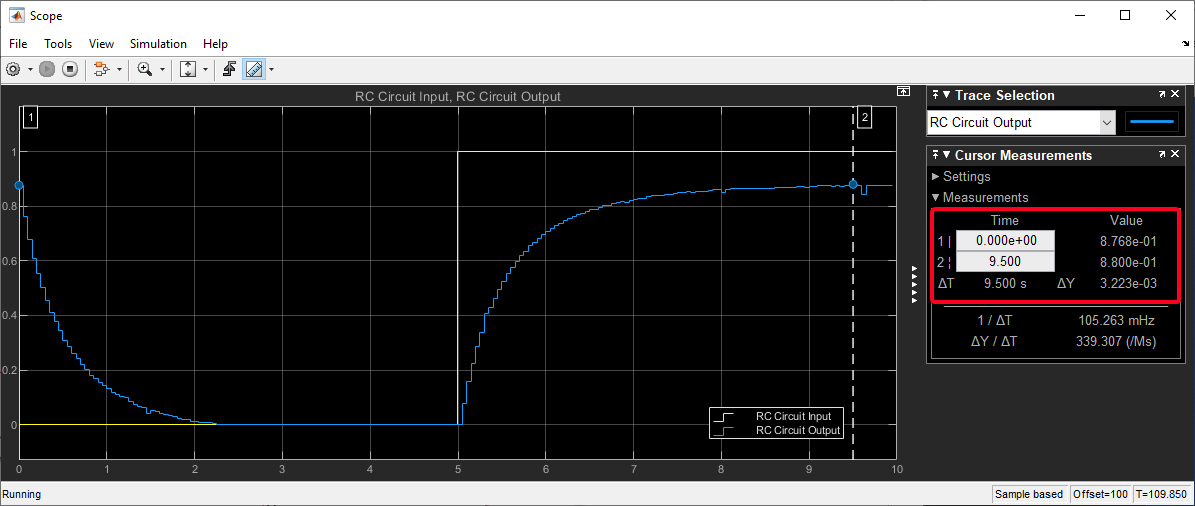
Figure 10: Simulation Results of the Simulink Hardware-in-the-Loop (HIL) Model for the RC Circuit (Plant Only)
Compare HIL results with Transfer Function results
Step 1: Converting Continuous-time Transfer Function to Discrete-time Transfer Function
When connecting both the continuous-time transfer function and the RC circuit model to the ESP32 microcontroller, need to work with discrete-time representations and algorithms. The ESP32 operates in discrete-time, handling sampled data, and requires discrete-time transfer functions.
Use following Matlab Commands to create Continuous-time Transfer Function:
Gs_num = [1];
Gs_den = [0.82 1];
Gs = tf(Gs_num,Gs_den)
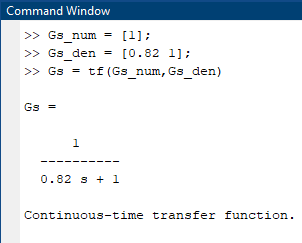
Figure 11: Matlab Commands for Creating the Continuous-time Transfer Function
Use following Matlab Command to convert to Discrete-time Transfer Function:
Gz = c2d(Gs,0.05,'zoh')
0.05 - Sample time
'zoh' - Discretization method: Zero-order hold (default). Assumes the control inputs are piecewise constant over the sample time Ts.
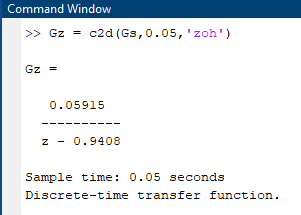
Figure 12: Matlab Command for Converting to Discrete-time Transfer Function
Step 2: Edit the Simulink model
Use following blocks:
•For Discrete Transfer Function : Discrete Transfer Fcn
Simulink Model: rc_hil_plant.slx
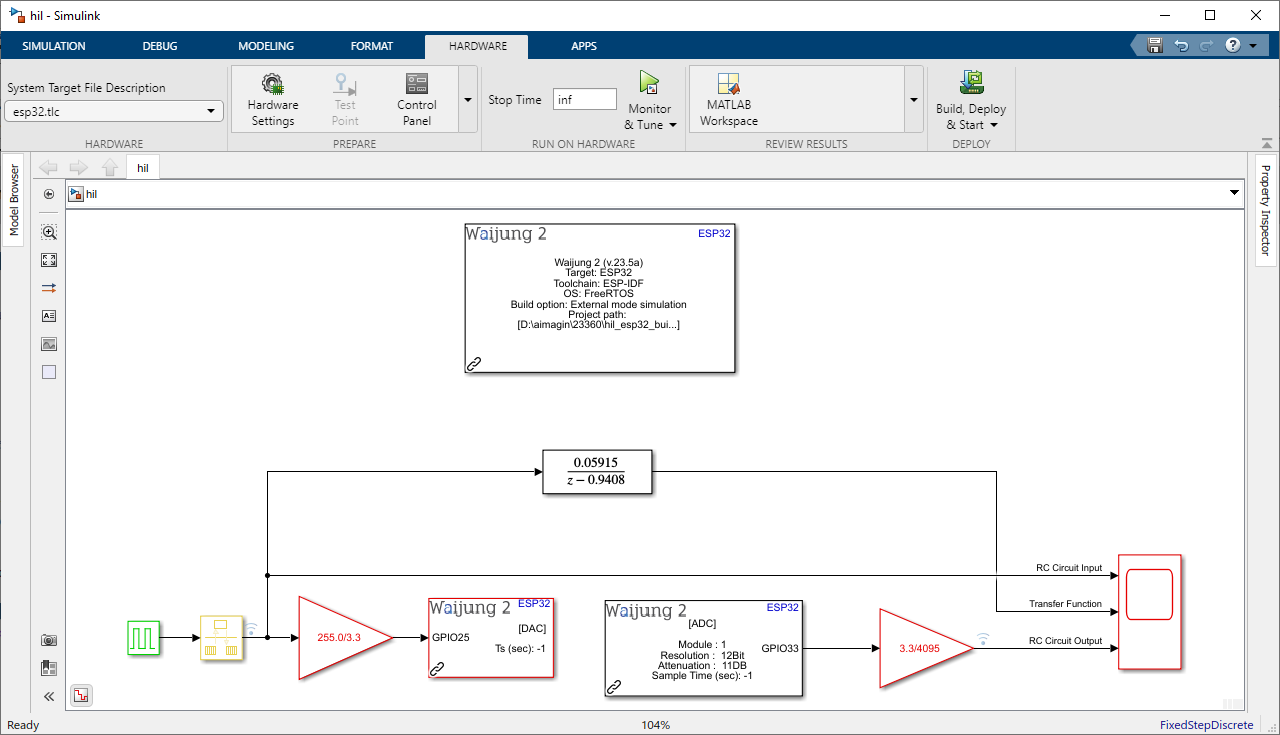
Figure 13: Simulink Hardware-in-the-Loop (HIL) Model Integrating Discrete-time Transfer Function (Simulation) and actual RC Circuit (Plant Only)
Step 3: Run Simulation and Open Scope for the results
Reference: How to run HIL simulation
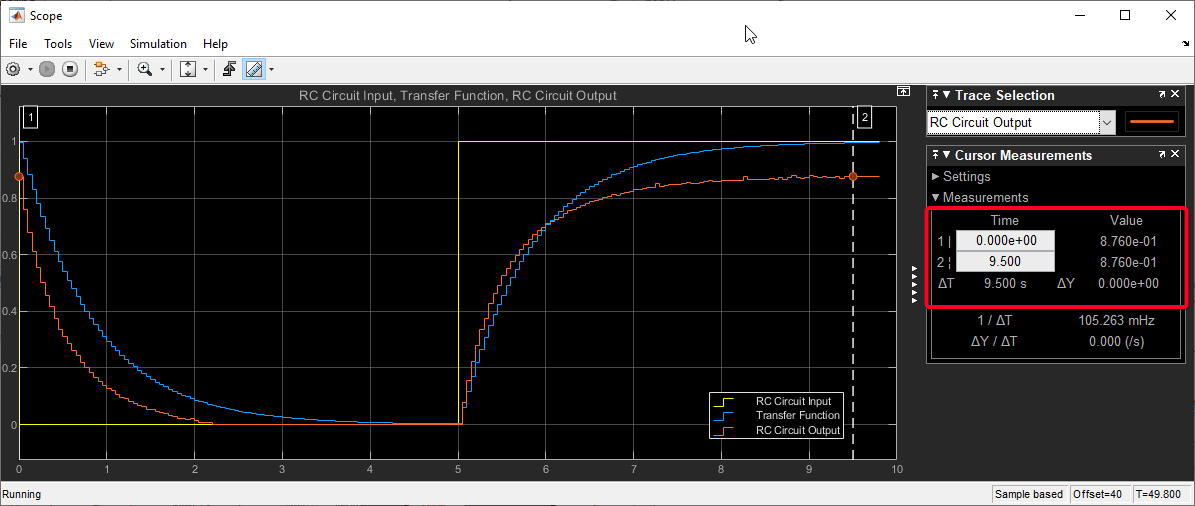
Figure 14: Comparative Results of Simulink Hardware-in-the-Loop (HIL) Model Incorporating Discrete-time Transfer Function (Simulation) and Actual RC Circuit (Plant Only)
In the Figure 14 graph, three distinct curves can be observed: the RC circuit input (Yellow), transfer function output (Blue), and actual RC circuit output (Red). The RC circuit input represents the applied voltage signal to the RC circuit, showing how the voltage varies over time. The transfer function output is derived from the theoretical transfer function of the RC circuit, which predicts the expected response of the circuit to the input signal. However, when comparing the actual RC circuit output to the transfer function output, noticeable differences can be observed. The actual RC circuit output represents the actual measured response of the circuit to the input signal. Deviations between the actual RC circuit output and the transfer function output indicate discrepancies between the real-world behavior of the circuit and its ideal theoretical model. These differences could arise due to various factors, such as component tolerances, temperature effects, or limitations in the ADC's accuracy. Proper calibration and analysis of these variations are crucial for achieving accurate results in practical applications.
Why ADC calibration is needed?
ADC calibration is essential because analog-to-digital converters (ADCs) used in microcontrollers, such as the ESP32, are not perfect and can introduce inaccuracies in their measurements. These inaccuracies can be caused by various factors, including manufacturing tolerances, temperature variations, and noise.
Calibrating ADC values using Matlab Script
Step 1: Include two 'To Workspace' blocks to save output data from Transfer Function and RC Circuit to the Matlab Workspace
Select "Structure with Time" as the Save Format.
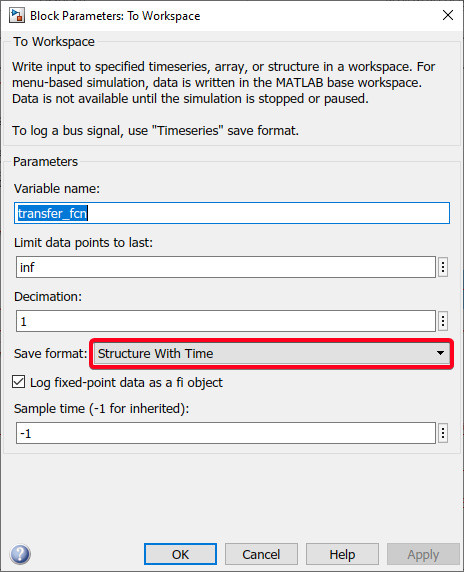
Figure 15: Block parameters of the "To Workspace" block
Simulink Model: rc_hil_plant_collect.slx
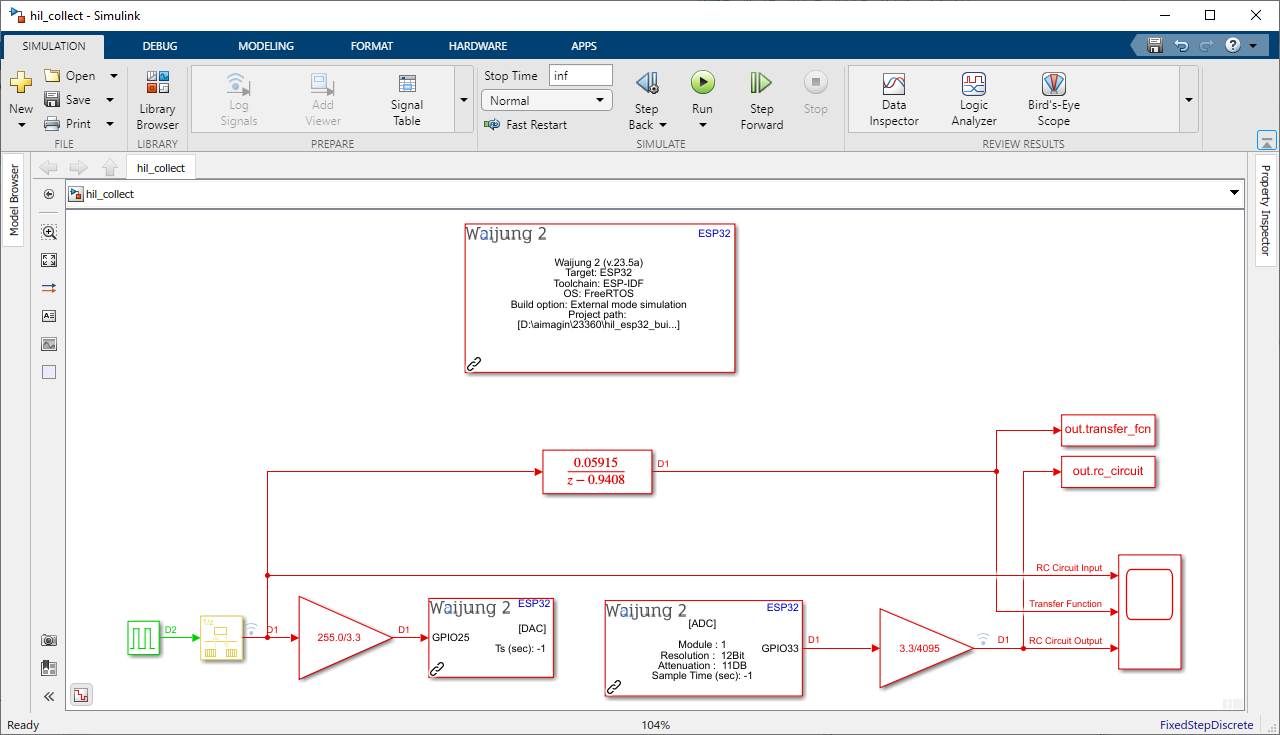
Figure 16: Simulink Hardware-in-the-Loop (HIL) Model Configuration for Collecting Results of Discrete-time Transfer Function (Simulation) and Actual RC Circuit (Plant Only)
Step 2: Run HIL simulation
Reference: How to run HIL simulation
Once the simulation concludes, the data will be stored within the MATLAB Workspace as shown in the Figure 17.

Figure 17: Data Storage in MATLAB Workspace Upon Completion of the Simulation
Step 3: Run Matlab script file to get the mean peak error
Script file: rc_adc_calibration.m
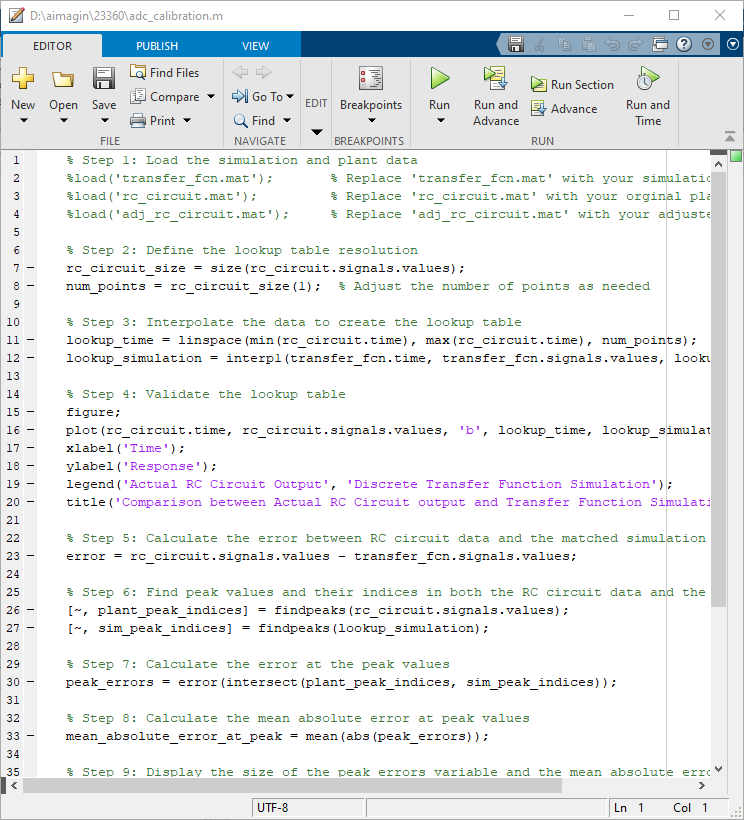
Figure 18: MATLAB Script for Calculating Mean Peak Error to Calibrate ADC Reading
Results

Figure 19: Results of the adc_calibration.m MATLAB Script
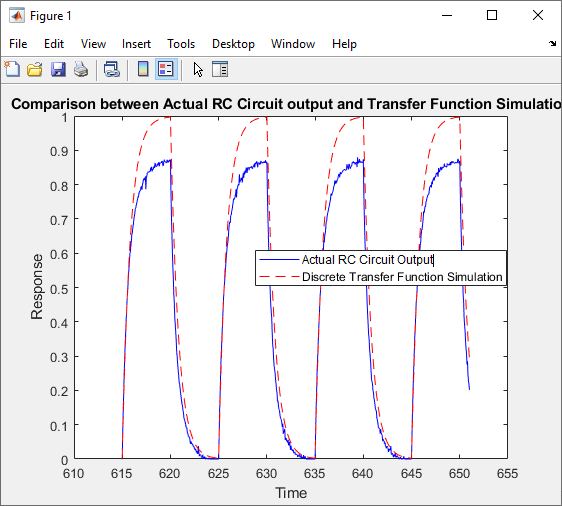
Figure 20: Comparison Plot between Discrete-time Transfer Function (Simulation) and Actual RC Circuit generated in the adc_calibration.m
Step 04: Edit model and include calibration value
Model File: rc_hil_plant_calibrate.slx
To implement the calibrated value into the Simulink model, follow these steps:
1.Add a Gain block to the Simulink model. Set the value of the Gain block to 0.14377, which corresponds to the calibration value calculated in the previous step.
2.Connect the input of the Gain block to the output of the ADC conversion gain block.
3.Next, insert an Add block into the model. This block will sum the output from the ADC conversion gain block with the output from the calibration value Gain block.
4.Connect one input of the Add block to the output of the ADC conversion gain block, and connect the other input to the output of the calibration value Gain block.
5.Finally, Connect the output of the Add block to Scope block of the model to visualize and monitor the results.
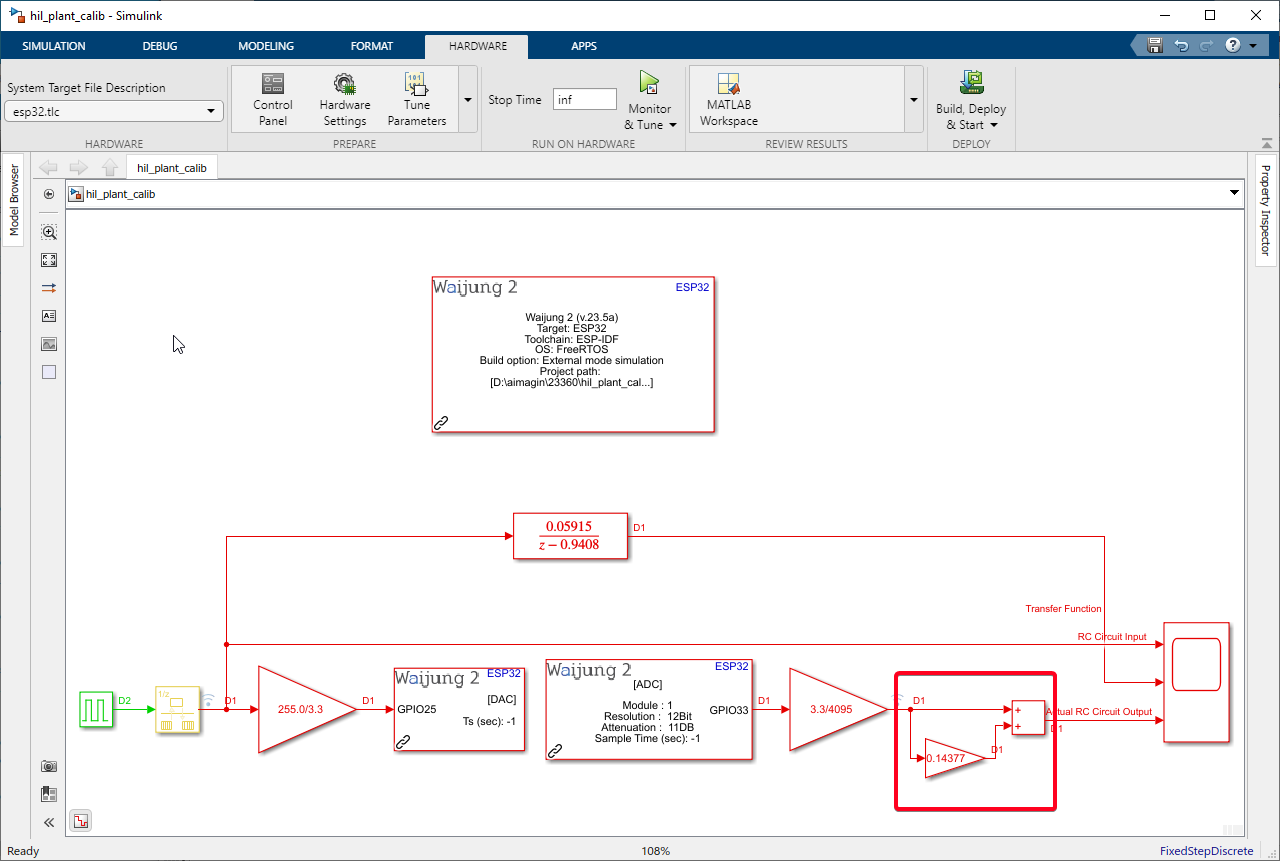
Figure 21: Edited Simulink HIL Model with Incorporated ADC Calibration Values
Step 05: Run HIL Simulation and Open Scope for the results
Reference: How to run HIL simulation
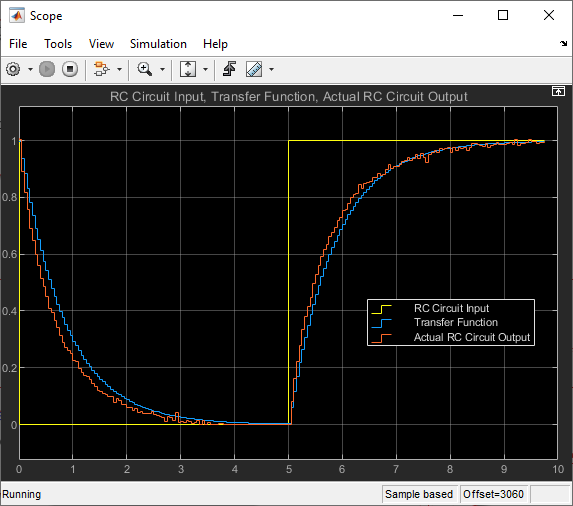
Figure 22: Results of Edited Simulink HIL Model with Incorporated ADC Calibration Values
ADC calibration plays a crucial role in ensuring the accuracy and reliability of the final outcome in a system. By applying a calibration value, such as 0.14377 with a known %error of 14.3769, the ADC's inherent imperfections and nonlinearities are accounted for and corrected. This correction significantly improves the precision of the converted analog signal.
RC Circuit System Identification
In the context of an RC circuit, system identification involves determining the values of the Time Constant(τ) which is the multiplication of resistor (R) and the capacitor (C) values that make up the circuit based on the input-output data obtained from experiments.The reason why only the RC value is involved in the system identification of an RC circuit is due to its first-degree system characteristic. A first-degree system, also known as a first-order system, has a transfer function with a single pole.
We have used following R and C values in the actual system.
Now, let's explain the relationship between 63.2% and the time constant of the RC circuit. When a step input is applied to an RC circuit, the output voltage starts to rise (or decay in case of a negative step) from its initial value towards the final value. The time it takes for the output voltage to reach approximately 63.2% of the final value is known as the time constant (τ).
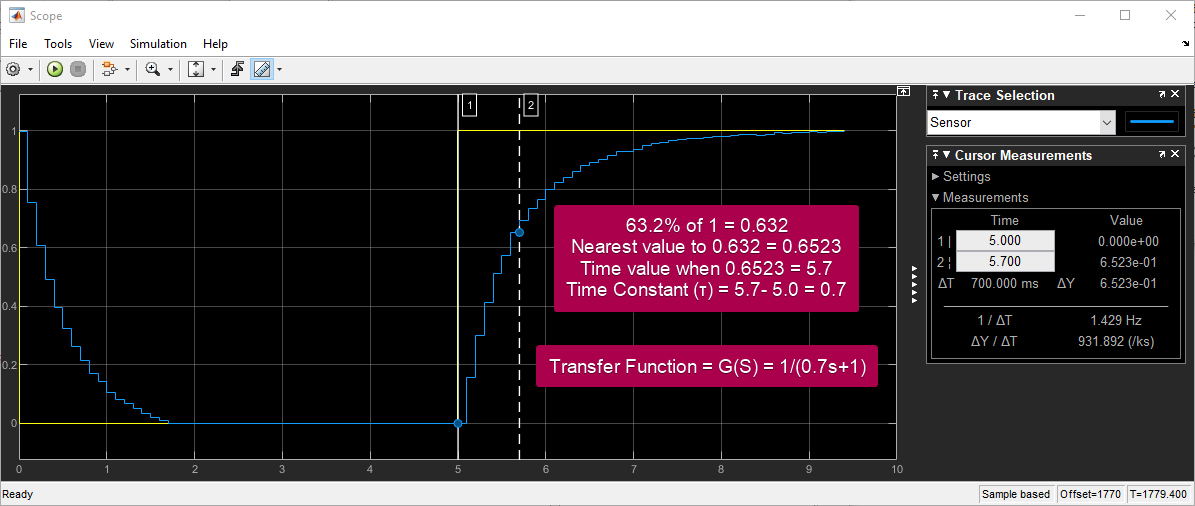
Figure 23: RC Circuit System Identification Plot
There are several reasons why the RC value obtained from system identification might not match the actual plant value. Some of the reasons include:
•Discretization Error: The ADC and DAC pins of the ESP32 might introduce discretization errors, as analog signals are quantized to digital values. This discretization process can affect the accuracy of the data used for system identification.
•Measurement Noise: During the data acquisition process, there might be measurement errors or noise present in the input-output data. This noise can lead to inaccuracies in the estimation of the system parameters, including the time constant (RC).