Controller performance specifications
Controller performance specifications, such as settling time and overshoot, play a crucial role in evaluating and designing control systems.
1.Settling Time: Settling time is the time it takes for the controlled output to reach and remain within a certain tolerance of the desired set-point after a disturbance or reference change. In other words, it measures how quickly the control system stabilizes and maintains the desired value. A shorter settling time indicates a faster response and better dynamic performance of the controller. Achieving a low settling time is particularly important in systems where quick and accurate responses are required, such as in high-speed manufacturing processes or critical control applications.
2.Overshoot: Overshoot refers to the extent by which the controlled output exceeds the desired set-point before eventually settling down. It is expressed as a percentage of the set point value. An overshoot occurs when the control system response oscillates around the set-point before converging to the desired value. In well-designed control systems, overshoot is typically minimized to avoid instability, oscillations, or potential damage to the system or the controlled process. High overshoot values can be detrimental in applications where stability and precision are essential, such as in control systems for chemical reactors, aircraft, or robotics.
In summary, settling time and overshoot are performance metrics that assess the dynamic behavior of a control system. A shorter settling time indicates a quicker response to disturbances, while minimizing overshoot helps maintain stability and accuracy. These specifications are critical in ensuring control system efficiency, stability, and suitability for specific applications. Engineers use these parameters to optimize controller design and achieve desired control objectives.
In this tutorial, we will explore two different methods for understanding and designing control systems.
First, we will use a web-based tool to draw the root locus of a system. The root locus is a graphical representation of the possible locations of the poles of a system as a particular parameter varies. This method provides a simple and intuitive way to visualize the behavior of a control system.
After gaining an understanding of the root locus method, we will delve deeper into control system design using an advanced tool: the Control System Toolbox from MATLAB. This toolbox provides a comprehensive environment for control system design and analysis. It allows us to specify our system in various forms, design and tune control systems, and validate our designs.
By exploring these two methods, we will gain both a fundamental understanding of control system behavior and practical experience with a powerful design tool. This combination of theory and practice will equip us with the knowledge and skills needed to tackle real-world control system design challenges.
Draw Root Locus plot using Web-based tool
Go to Drawing the root locus web page and insert the Numerator Polynomial, N(s): and the Denominator Polynomial, D(s):
We will design a Proportional-Integral (PI) controller, the transfer function of the controller H(s) would be , where Kp is the proportional gain and Ki is the integral gain.
Given your plant transfer function G(s) = 1/(0.82s+1), the open-loop transfer function G(s)H(s) of the system would be:
This can also be written as:
Numerator Polynomial, N(s): This is the polynomial in the numerator of G(s)H(s), which is Kps + Ki. Depending on the specific values of Kp and Ki you choose for your controller, this could be something like 1s + 0.5 if Kp = 1 and Ki = 2, for example.
Denominator Polynomial, D(s): This is the polynomial in the denominator of G(s)H(s), which is 0.82s^2 + s.
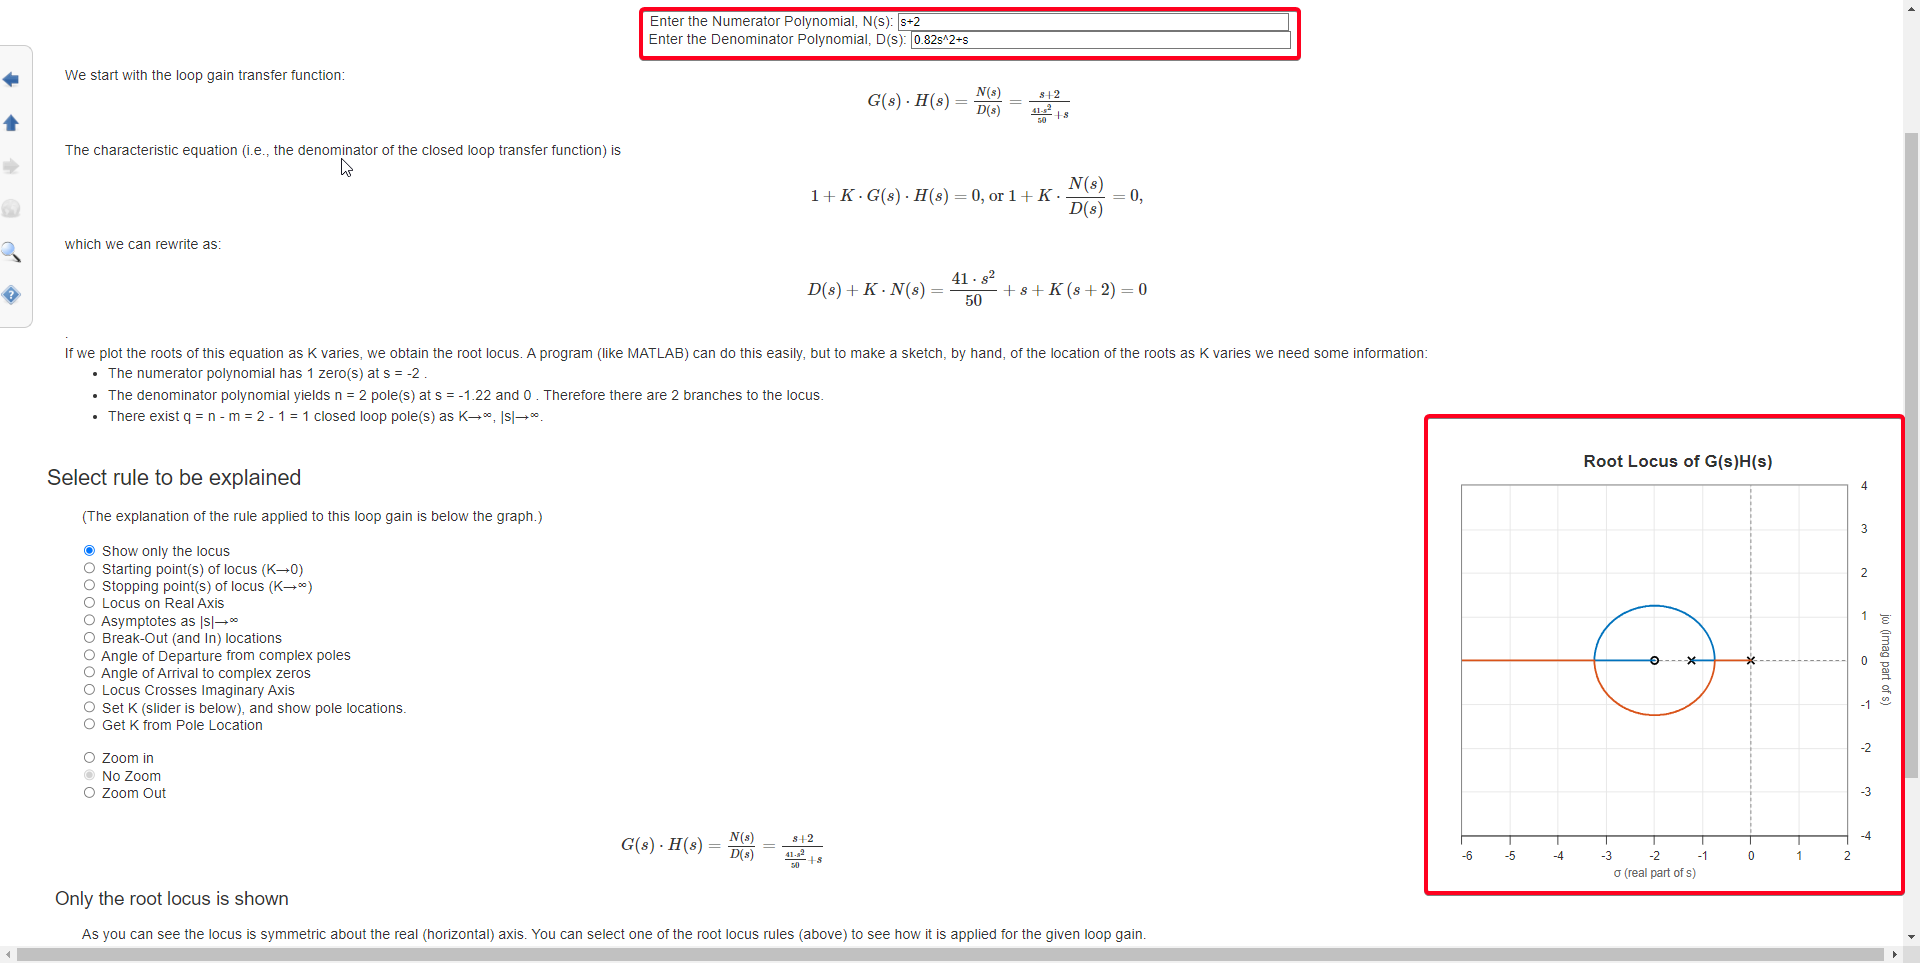
Figure 24: Root Locus plot
Controller Performance Requirements
•Requirement 01: Settling time < 1s
•Requirement 02: Overshoot < 2%
The settling time and percent overshoot PO are related to the damping ratio ζ and natural frequency of the system.
The settling time is approximately:
and the percent overshoot is approximately
Given your requirements of < 1s and PO < 2%, we can solve these equations to find the desired range of ζ and , and then show this region on the root locus plot.
From the settling time equation, we have
For a settling time of
< 1s
we can rearrange to find
ζ > 4
In the root locus plot, the real part of the pole location corresponds to the value of -ζ. So, if ζ > 4 for s < 1s, then in the root locus plot, you would look for the region where the real part of the pole is less than -4.
The percent overshoot PO is approximately
For an overshoot of PO < 2%,
we can rearrange to find
ζ > 0.6.
The angle θ that a complex pole subtends to the origin of the s-plane determines the damping ratio ζ of an under-damped 2nd order system.
Therefore, you can calculate θ using the relationship
For ζ > 0.6,
this gives
Therefore, you would draw lines on your root locus plot at angles of ±53.13° from the negative real axis. These lines represent the locations of the poles for a system with a percent overshoot of less than 2%
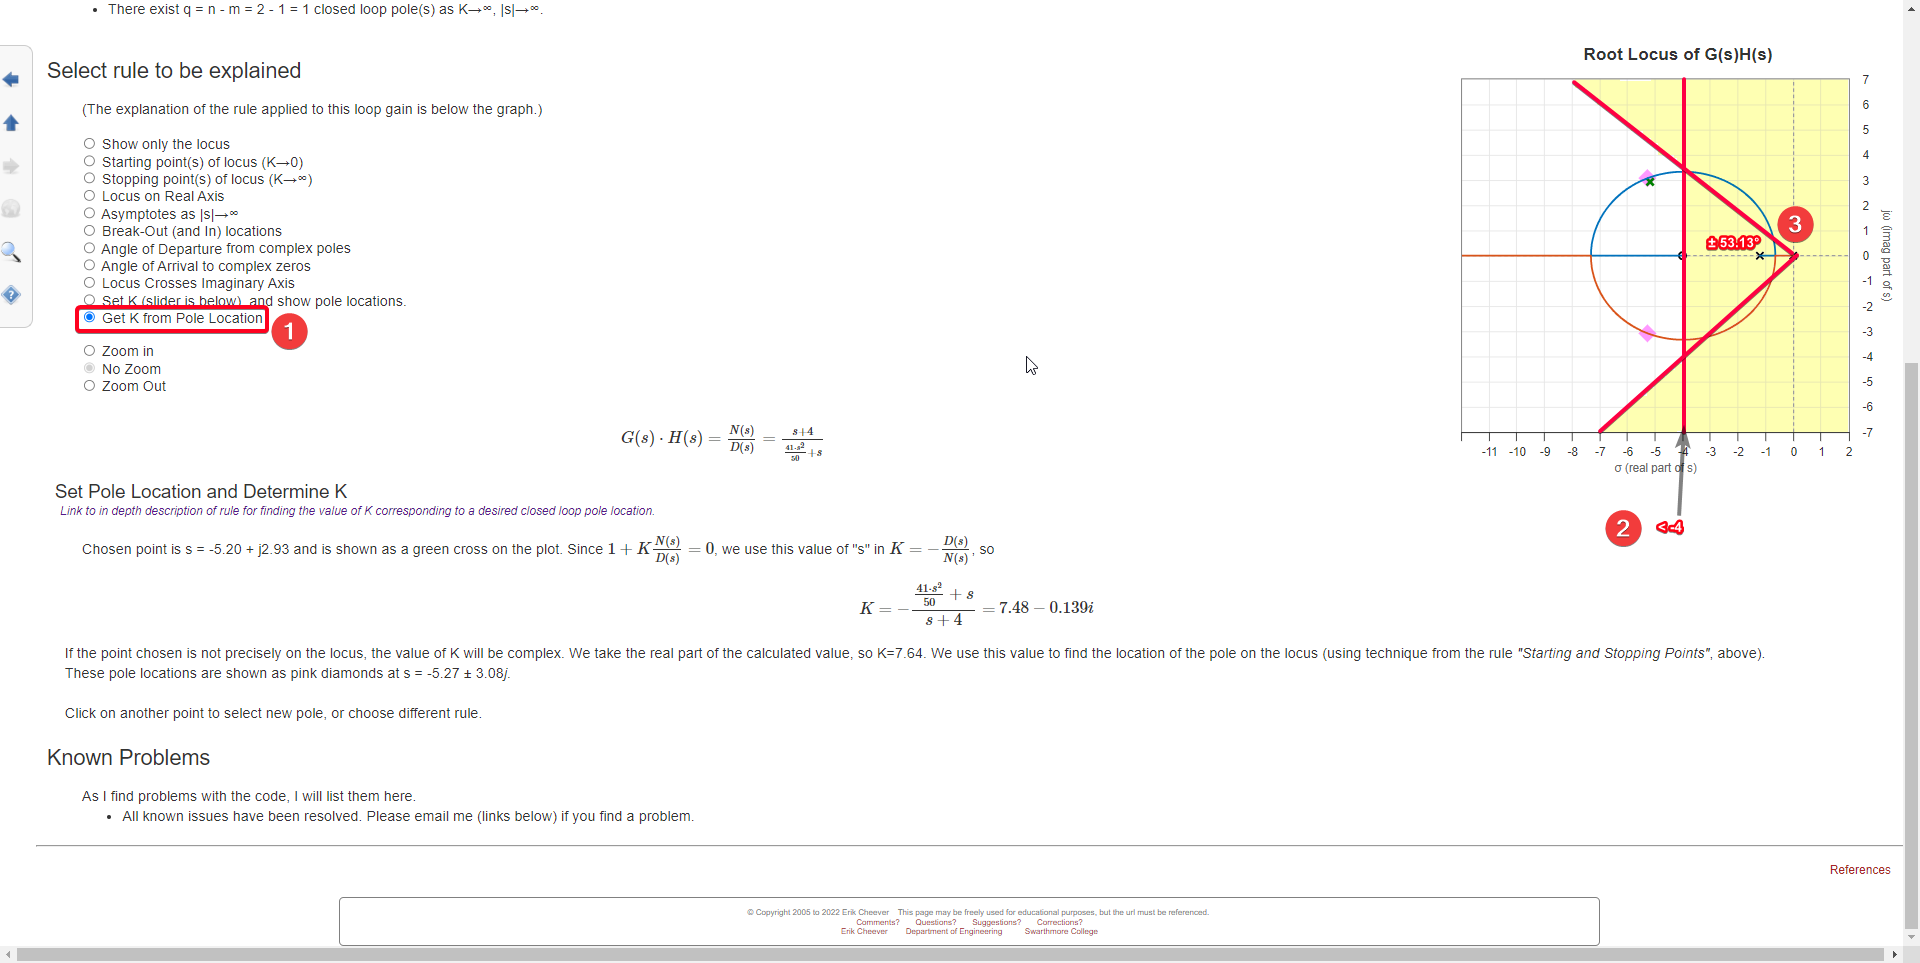
Figure 25: Controller requirements on the Root Locus
Please note that these are approximate solutions and the actual values may vary depending on the specific characteristics of your system. It’s also important to validate these values with simulations and real-world testing
Final Controller design
We get the determined = 7.481 and use the = 0.76.
In order to convert this to:
, where K is the gain and z is the zero of the controller.
Calculate,
.
Calculate,
we can rearrange to find
Design controller using Matlab Control System Designer App
Matlab Control System Designer App References:
Getting Started with the Matlab Control System Designer
Explanation Video of Control System Design with the Control System Designer App
Controller Performance Requirements
•Settling time < 1s
•Overshoot < 2%
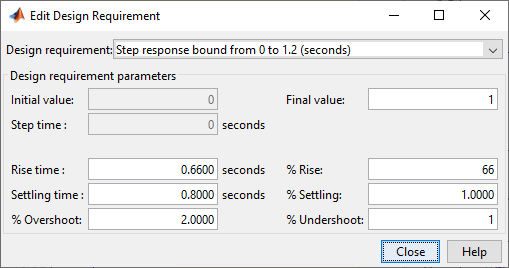
Figure 26: Controller Performance Requirements Set in the Control System Designer App
Line should be within the boundaries of highlighted white color area as Figure 25.
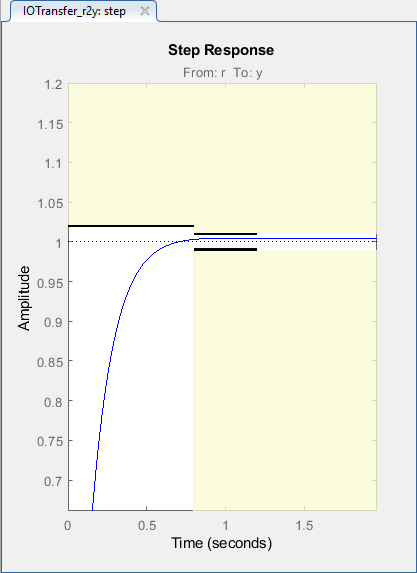
Figure 27: Step Response Graph with Marked System Design Requirements
In the MATLAB Control System Designer, the root locus plot provides valuable insights into the stability and performance characteristics of control systems. To improve the design process, you can add new performance requirements to the root locus plot by right-clicking on the graph's white space. By specifying overshoot percentage and settling time requirements, you can set explicit criteria for the system's transient response.
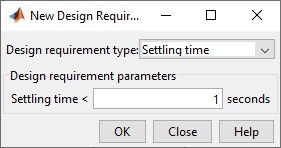
Figure 28: Adding Settling Time Design Requirement in the Root Locus Graph
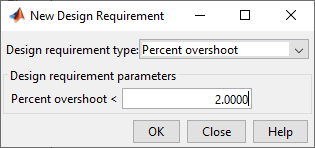
Figure 29: Adding Precent Overshoot Design Requirement in the Root Locus Graph
Once you set these requirements, the root locus plot will visually indicate the regions that satisfy the specified overshoot and settling time criteria. These regions will be highlighted in white. Conversely, the areas that do not meet the requirements will be colored in yellow.
This graphical representation allows you to identify the regions in the complex plane that fulfill the desired performance specifications.
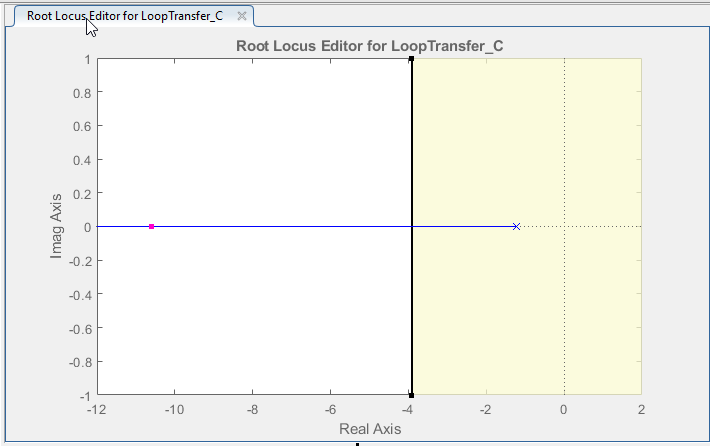
Figure 30: Display of Added Settling Time Design Requirement on the Root Locus Graph
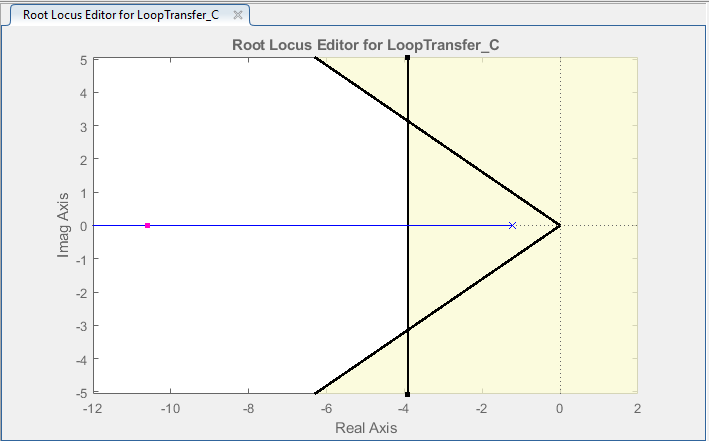
Figure 31: Display of Added Precent Overshoot Design Requirement on the Root Locus Graph
By manipulating the positions of poles on the root locus plot, the control system designer can assess the impact on overshoot and settling time in real-time. The goal is to find the optimal pole locations that strike a balance between achieving the desired performance and maintaining system stability.
Final Controller design
Controller System Designer file: rc_ControlSystemDesignerSession.mat
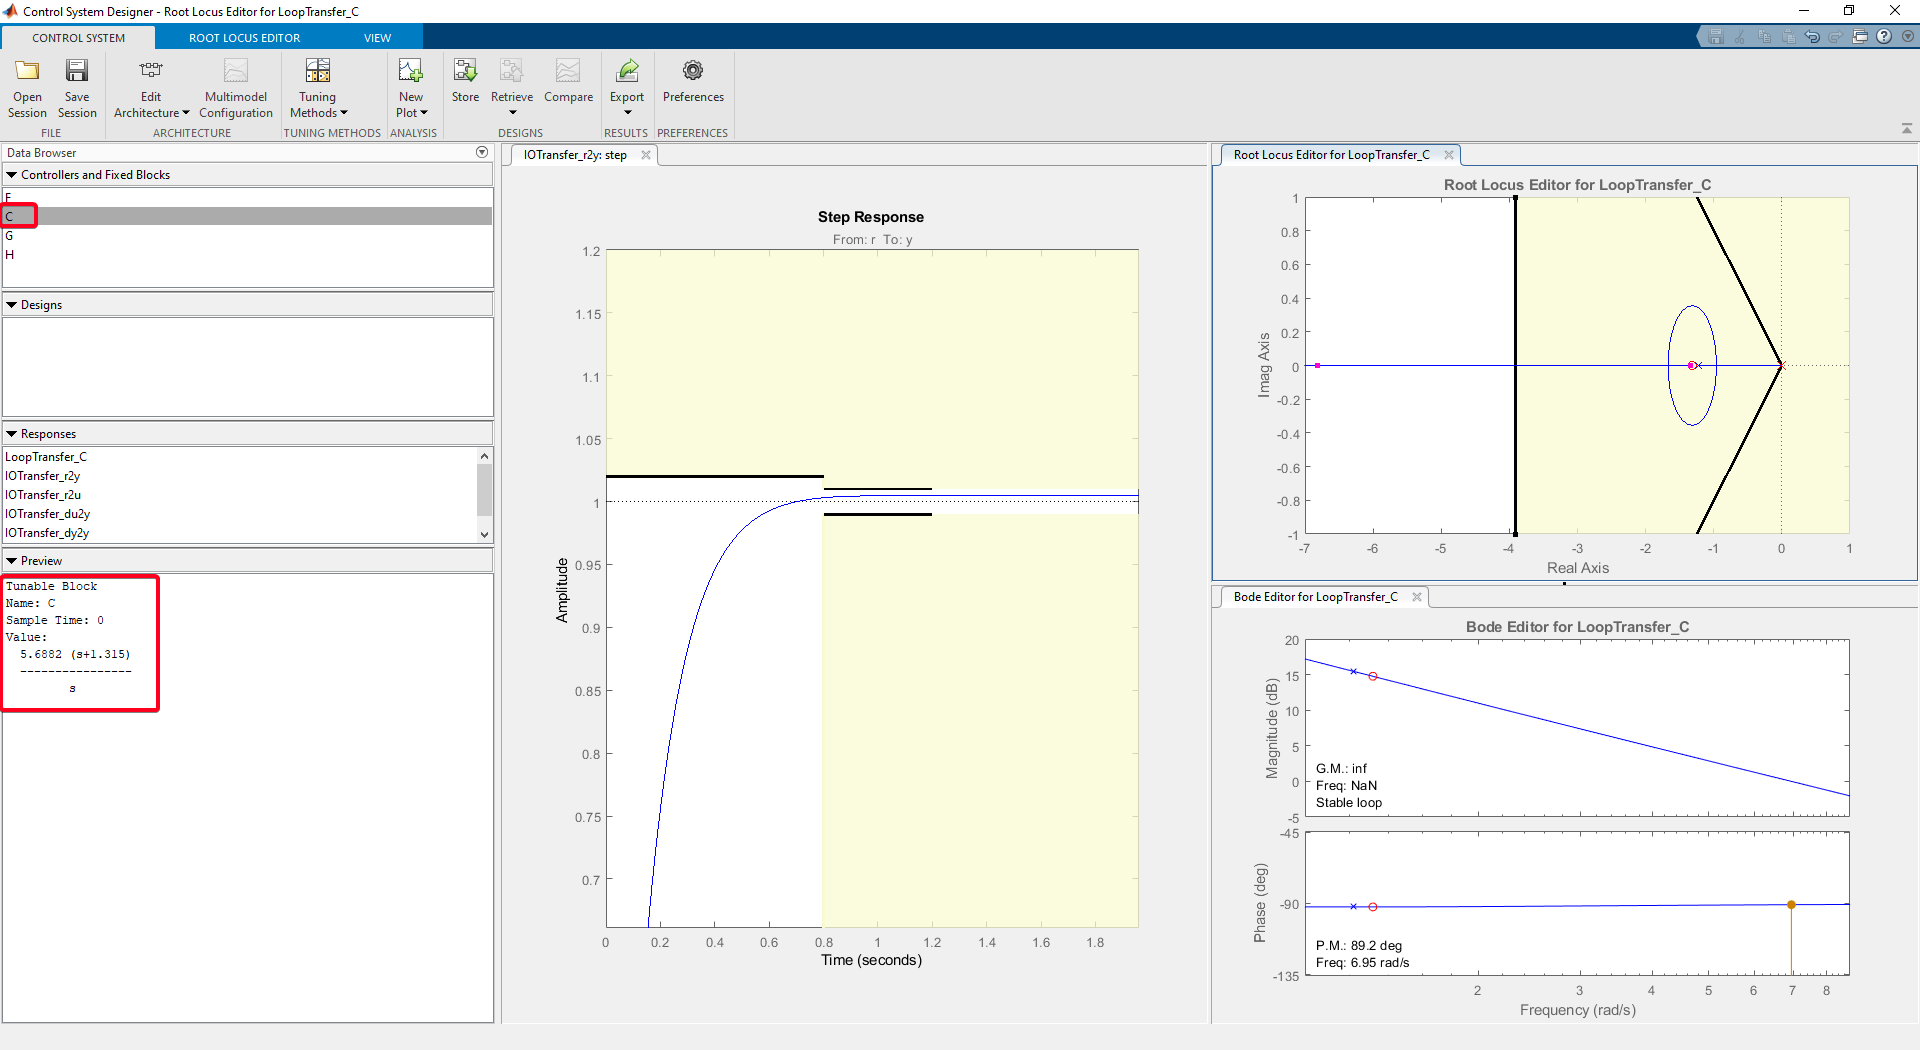
Figure 32: Final Controller Design Achieved Through Optimization
Final Controller design Characteristic
•Settling time (seconds): 0.513
•Overshoot (%): 0.456
•Rise time (seconds): 0.306
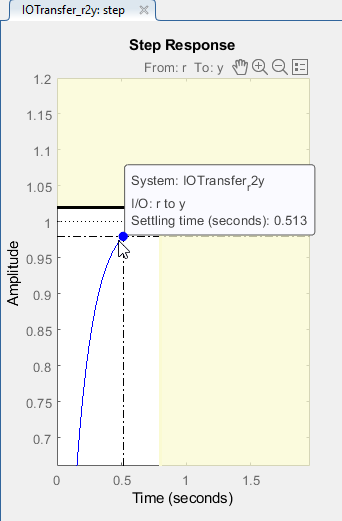
Figure 33: Settling Time Characteristic of Final Controller Design Reflected in the Step Response Graph
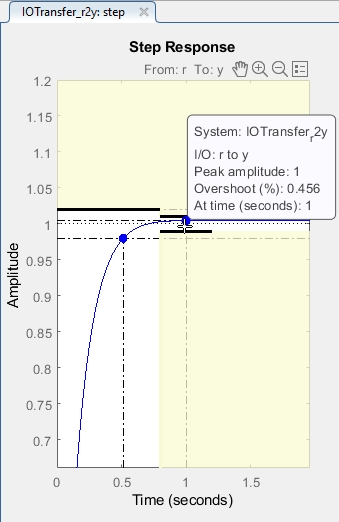
Figure 34: Overshoot Characteristic of Final Controller Design Reflected in the Step Response Graph
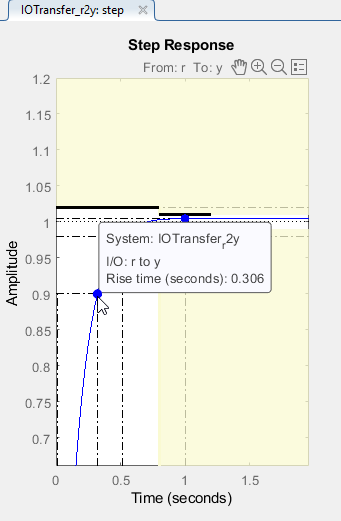
Figure 35: Rise Time Characteristic of Final Controller Design Reflected in the Step Response Graph
Evaluate Designed Controller Performance
Step 1: Get Designed Controller Transfer Function
Step 2: Create the Simulink model
Simulink Model: rc_controller_sim.slx
Use following blocks:
•For Input : Use Step block
•To create transfer function for controller and plant : Transfer Fcn
•For Output : Use Scope
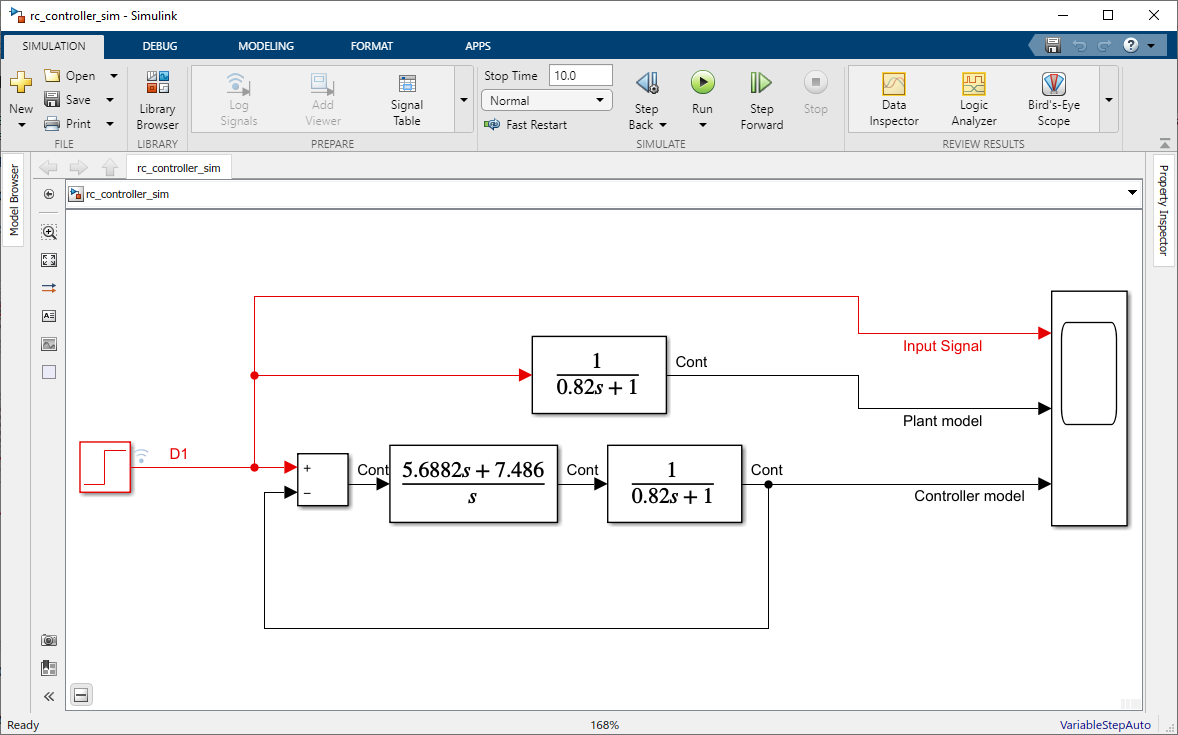
Figure 36: Simulink Model File for Demonstrating the Performance of the Designed Controller
Step 3: Run Simulation and Open Scope for the results
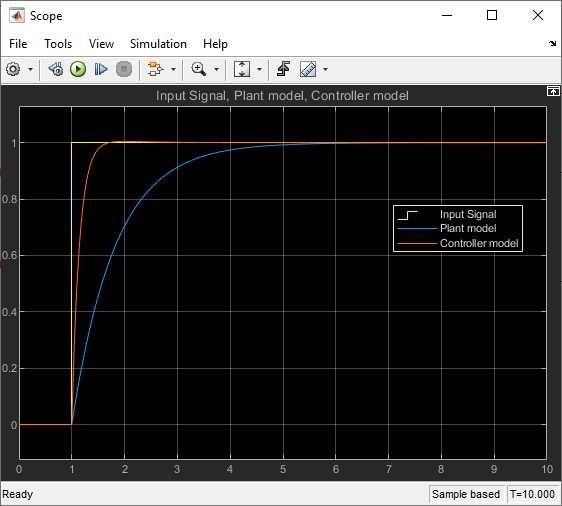
Figure 37: Simulation Results Illustrating the Performance of the Designed Controller in the Simulink Model
The Figure 35 graph illustrates the impact of utilizing a feedback controller on system performance in relation to the simulation results of the plant model. It is worth highlighting that we can leverage a feedback controller to enhance system performance while keeping the plant model unchanged. The closed-loop response captures the behavior of the system's output concerning input commands or disturbances. Through a direct comparison between the controller's response and the simulation of the plant model, we can evaluate the controller's efficacy in attaining the intended control objectives without any alterations to the plant model itself. The ultimate aim is to minimize overshoot, hasten settling time, ensure stability, and achieve precise set-point tracking. A situation where the controller's performance surpasses the expectations set by the plant model simulation signifies a well-executed design characterized by enhanced dynamic attributes.