In the initial segment of this tutorial, our focus will be on developing the simulation model for the Discrete-time Control System, encompassing both the controller and the plant. This simulation model serves as the foundation for our subsequent analysis. By meticulously constructing this Discrete-time Control System (Controller + Plant) Simulation, we establish a benchmark against which we can evaluate the outcomes of our later Hardware-in-the-Loop (HIL) simulations.
Discrete-time Control System (Controller + Plant) Simulation
Step 1: Get Designed Controller & Plant Transfer Function (Discrete-time)
Step 2: Create the Simulink model
Simulink Model: rc_control_system_sim.slx
Use following blocks:
•For Input : Use Step block
•To create controller and plant : Discrete Transfer Fcn, Add, Rate Transition
•For Output : Use Scope
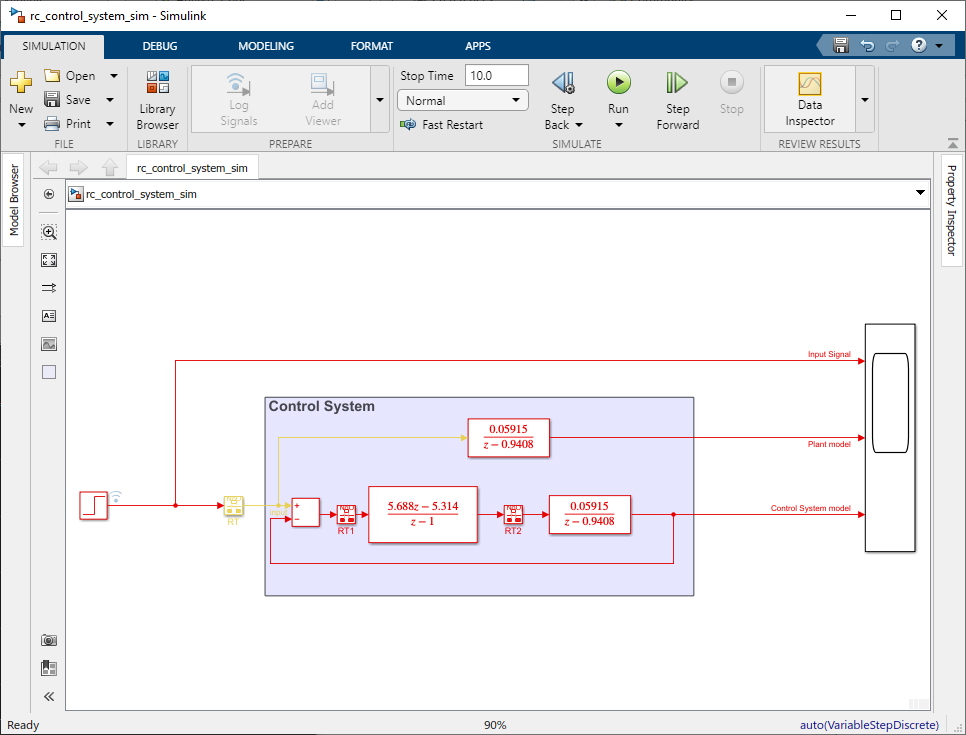
Figure 42: Simulink Model of the Discrete-time Control System (Controller + Plant) Simulation
Step 3: Run Simulation and Open Scope for the results
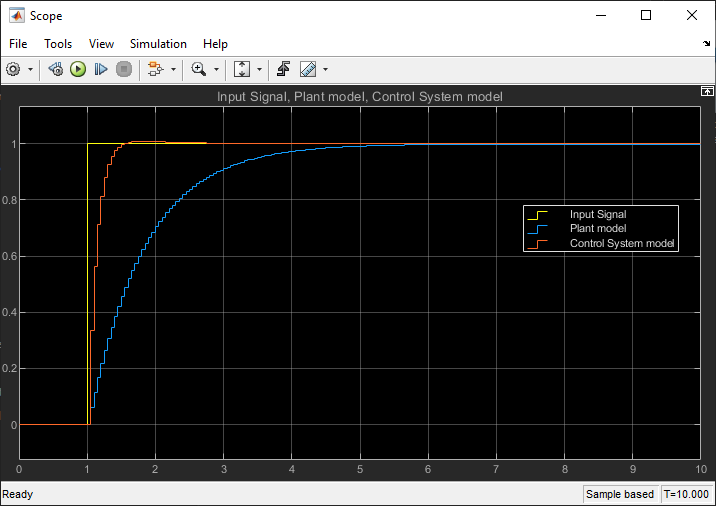
Figure 43: Simulation Results of the Discrete-time Control System (Controller + Plant) Simulation in Simulink
Figure 41 illustrates the behavior of an RC circuit control system, comprising both the controller and the plant. The plot displays three distinct elements: the output of the complete control system, the output of the plant model alone, and the input signal. By showcasing these components together, the figure provides valuable insights into the system's dynamics. The output of the complete control system demonstrates how the combined action of the controller and the plant influences the response to the input signal. On the other hand, the plant model's output, depicted separately, highlights the raw behavior of the plant in the absence of control. The input signal serves as the reference against which both outputs are evaluated. Overall, Figure 41 offers a concise visual representation of how the control system modifies the plant's response to achieve the desired output in comparison to the uncontrolled plant behavior.
Discrete-time Control System (Controller + Plant) on Hardware-In-the-Loop (HIL) with Waijung2
Step 1: Create the Simulink model
Simulink Model: rc_hil_control_system.slx
Use following blocks:
•For Input : Use Pulse Generator
•Waijung 2 blocks : Target Setup,DAC,ADC
•For Output : Use Scope
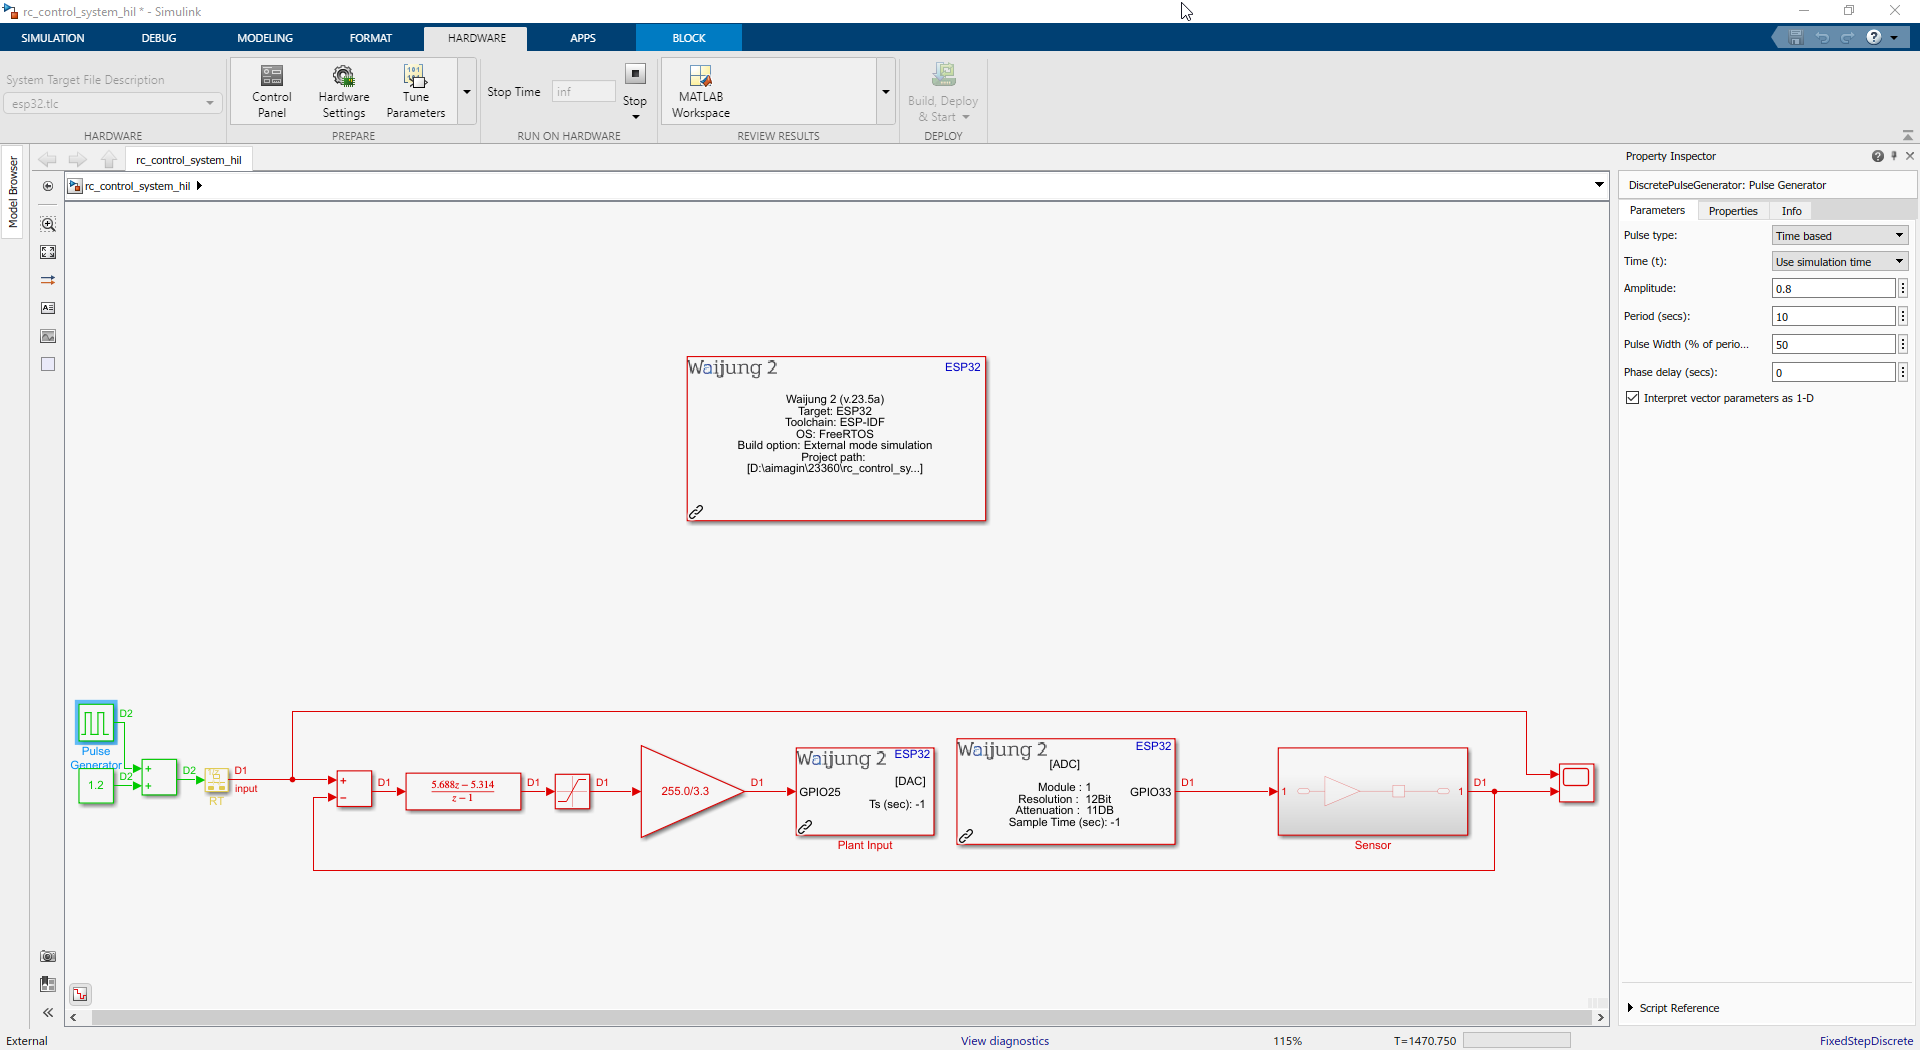
Figure 44: Simulink Model of Discrete-time Control System (Controller + Plant) on Hardware-In-the-Loop (HIL) using Waijung2
Step 2: Run HIL Simulation and Open Scope for the results
Reference: How to run HIL simulation
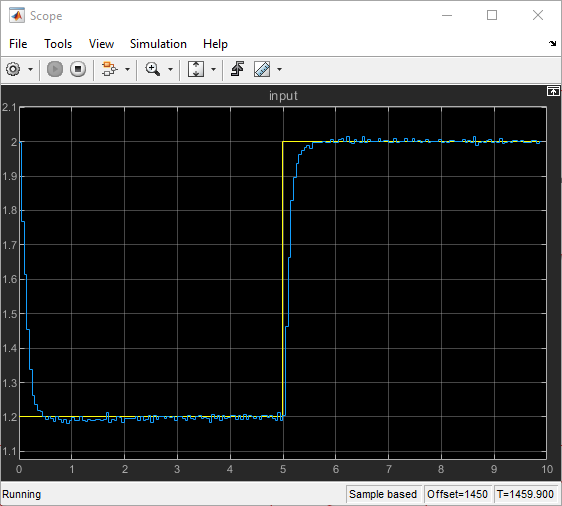
Figure 45: Results of Simulink Model for Discrete-time Control System (Controller + Plant) on Hardware-In-the-Loop (HIL) with Waijung2
Compare HIL Result with Discrete-time Control System Simulation
Step 1: Create the Simulink model
Simulink Model: rc_hil_control_system_comparison.slx
Use following blocks:
•For Input : Use Pulse Generator
•To create controller : Discrete Transfer Fcn, Add, Rate Transition
•Waijung 2 blocks : Target Setup,DAC,ADC
•For Output : Use Scope
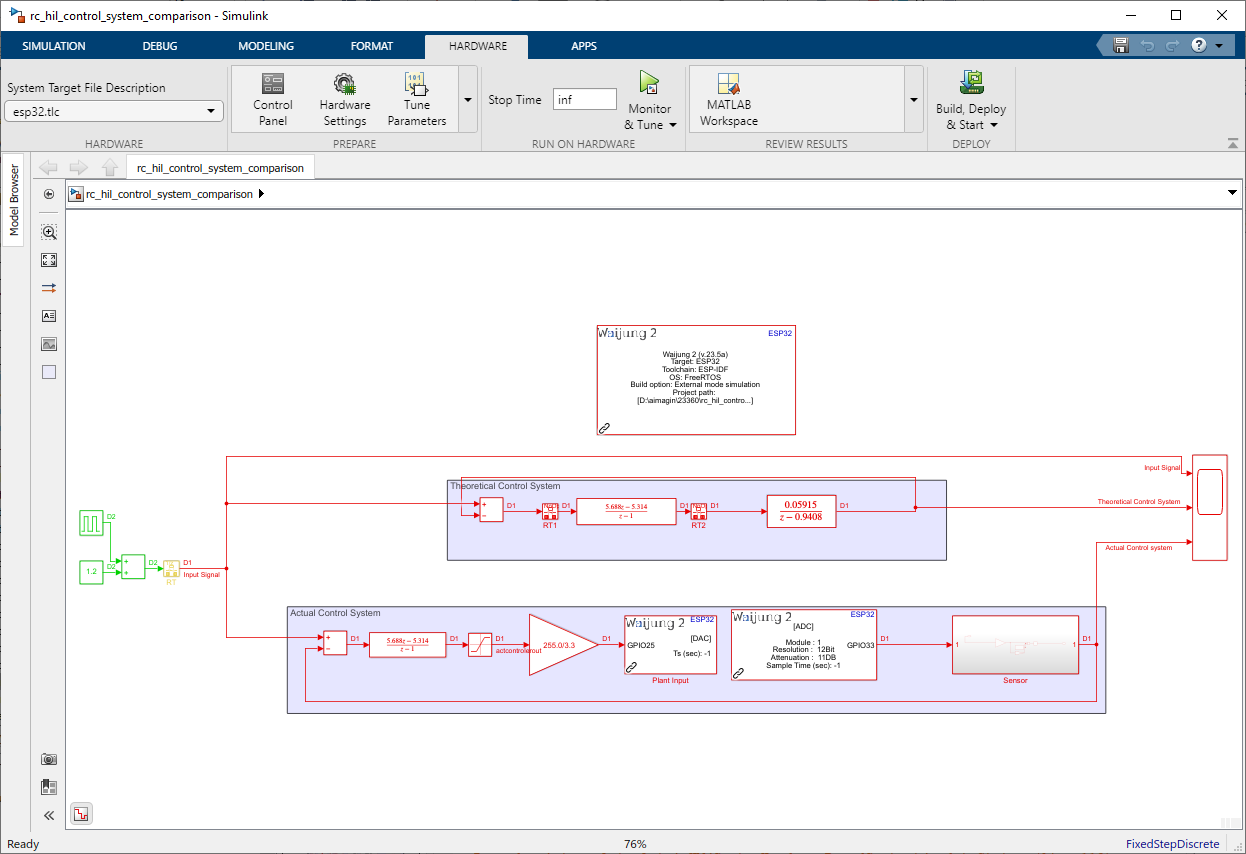
Figure 46: Simulink Model for Comparing Hardware-In-the-Loop (HIL) Results with Discrete-time Control System Simulation
Step 2: Run HIL Simulation and Open Scope for the results
Reference: How to run HIL simulation
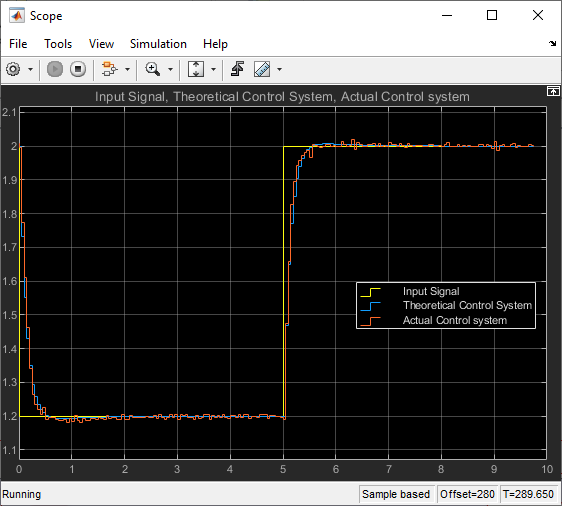
Figure 47: Comparative Results of Simulink Model Comparing Hardware-In-the-Loop (HIL) Simulation Outcome with Discrete-time Control System Simulation
The near-identical graph obtained from the Hardware in the Loop (HIL) simulation, as shown in Figure 45, indicates that the theoretical control system's predictions are in close agreement with the hardware's actual responses. This congruence can be attributed to precise modeling, effective controller design, and appropriate calibration of the hardware components. The favorable outcome holds significant implications for real-world applications. It signifies that the theoretical approach can reliably predict the control system's behavior under various conditions, providing a cost-effective and efficient way to develop and refine control strategies before deployment. Moreover, the alignment between the simulation and hardware validates the theoretical understanding of the system's dynamics, instilling confidence in the control system's performance in real-world scenarios.
Control Effort
Control effort, in the context of a control system, refers to the amount of energy, force, or action exerted by the controller to manipulate the plant (the system being controlled) in order to achieve a desired output or set-point. It represents the actions taken by the controller to regulate the plant's behavior and bring its output closer to the desired target.
In a control loop, the controller continually computes a control signal based on the difference between the desired set-point and the actual output of the plant. This control signal is then applied to the plant to adjust its behavior. The magnitude of this control signal is an indicator of the control effort required to achieve the desired outcome.
Input Signal range: 0-2v
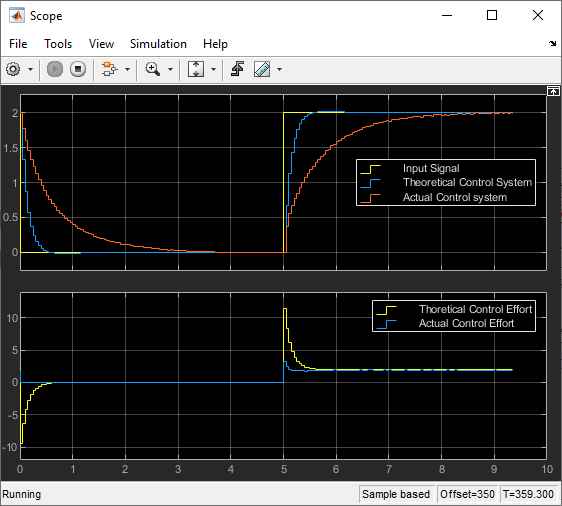
Figure 48: Theoretical and Actual Control Effort in the Input Signal Range 0-2V
As shown in Figure 46 when analyzing the input signal's range spanning from 0 to 2, the graphical representation illustrates a notable disparity between the theoretical control effort and the actual control effort. While the theoretical model suggests a control effort exceeding 10, the practical limitations of the system restrict the actual control effort to a maximum of 3.3 due to the operational range of the controlling ESP32. Consequently, this discrepancy between the theoretical and practical control efforts accounts for the significant disparity observed between the actual control effort output and the projected output of the theoretical control system.
In this context, managing the input signal becomes crucial for maintaining effective control within the ESP32's voltage range. By adjusting the input signal sent to the RC circuit, you can ensure that the resulting control effort remains within the 0-3.3 volts range, which is the operational limit of the ESP32.
Input Signal range: 1.2-2v
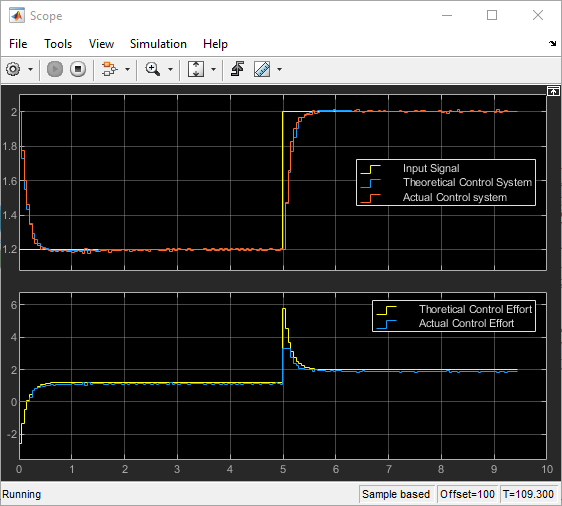
Figure 49: Theoretical and Actual Control Effort in the Input Signal Range 1.2-2V
Control effort, in this case, involves carefully selecting and scaling the control signals to correspond to the desired manipulation of the RC circuit. By controlling the input signal and subsequently the control effort, as depicted in Figure 47, you can regulate the plant's behavior while staying within the ESP32's voltage capabilities. This highlights the pivotal role of control strategy design in achieving desired outcomes while working within hardware constraints. Properly managing control effort and input signals ensures effective control system performance and adherence to the operational limits of the controlling micro-controller.