How does this component appear in a web page?
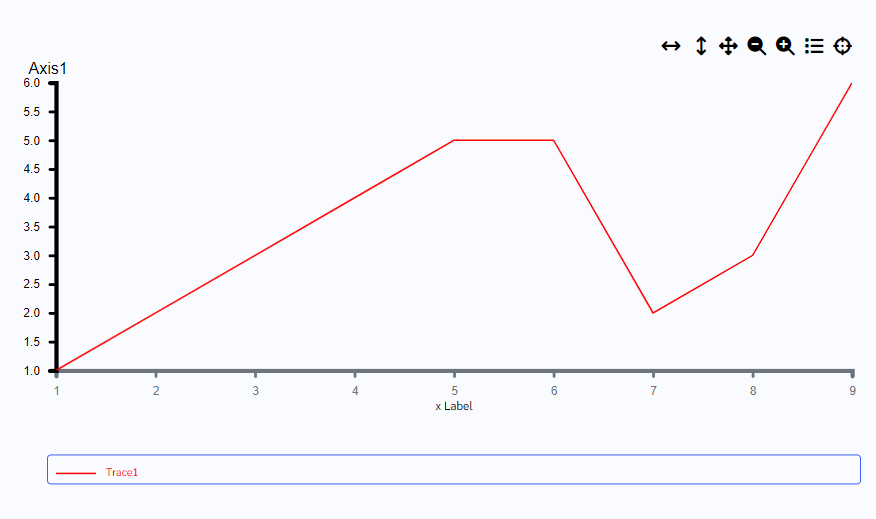
Animation
How does this component appears in Aimagin Connect?
What can be configured?
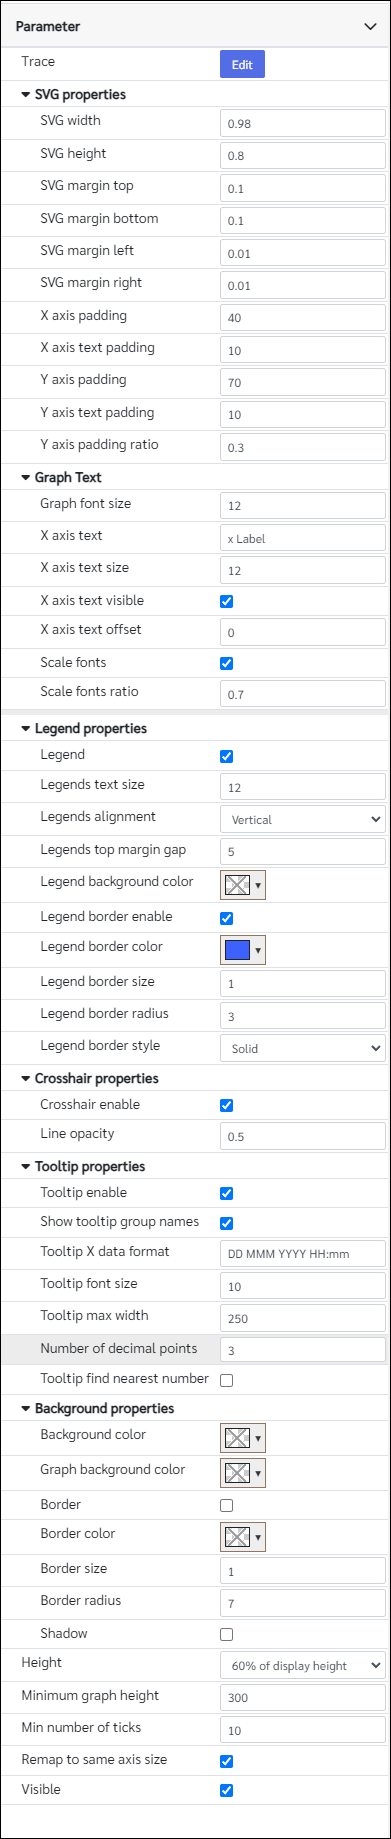
Parameters
Configuration Parameter |
Selectable Option/Value |
Description |
Default Value |
Data type |
Trace■■ |
|
Trace parameter is where the values and styles has been assign for the graph |
|
|
SVG width■■ |
|
Component width as a ratio of parent width. Enter a number below 1 Note Exact proportion of the width is depend on the total of "SVG width","SVG margin left","SVG margin right". Total of these should be equal or less than 1 |
0.98 |
Number |
SVG height■■ |
|
Component height as a ratio of parent height("Minimum graph height"). Enter a number below 1 Note Exact proportion of the height is depend on the total of "SVG height","SVG margin top","SVG margin bottom". Total of these should be equal or less than 1 |
0.8 |
Number |
SVG margin top■■ |
|
SVG margin top as a ratio of parent height("Minimum graph height"). Enter a number below 1 |
0.1 |
Number |
SVG margin bottom■■ |
|
SVG margin bottom as a ratio of parent height("Minimum graph height"). Enter a number below 1 |
0.1 |
Number |
SVG margin left■■ |
|
SVG margin left as a ratio of parent width. Enter a number below 1 |
0.01 |
Number |
SVG margin right■■ |
|
SVG margin right as a ratio of parent width. Enter a number below 1 |
0.01 |
Number |
X axis padding |
|
Gap between X axes |
30 |
Number |
X axis text padding |
|
Gap between X axis and the tick text |
10 |
Number |
Y axis padding |
|
Gap between Y axes |
70 |
Number |
Y axis text padding |
|
Gap between Y axis and the tick text |
10 |
Number |
Y axis padding ratio |
|
Y axis gap ratio to support responsive view. Enter a number below 1 |
0.3 |
Number |
Graph font size■■ |
|
Font size set for X and Y ticks in pixels |
10 |
Number |
X axis text■■ |
|
X axis text |
x Label |
String |
X axis text size■■ |
|
X axis font size Note: This number would be change if the scale font is enabled |
12 |
Number |
X axis text visible■■ |
true--false |
Show/Hide X axis text label |
true |
Boolean |
X axis text offset■■ |
|
X axis text offset from the top |
0 |
Number |
Scale fonts■■ |
true--false |
Scale fonts when responsive |
true |
Boolean |
Scale fonts ratio■■ |
|
Scale fonts ratio to support responsive view. Enter a number below 1 |
0.7 |
Number |
Legend |
true--false |
Show/Hide legends |
true |
Boolean |
Legends text size■■ |
|
Font size of the legends |
12 |
Number |
Legends alignment■■ |
Vertical--Horizontal |
Alignment of the legends |
Vertical |
String |
Legends top margin gap■■ |
|
Legends top margin gap in pixels |
5 |
Number |
Legend background color |
|
Legend background color |
|
Color |
Legend border enable |
true--false |
Legend border enable |
true |
Boolean |
Legend border color |
|
Legend border color |
rgba(60,97,253,1) |
Color |
Legend border size |
|
Legend border size in pixels |
1 |
Number |
Legend border radius |
|
Legend border radius in pixels |
3 |
Number |
Legend border style |
Solid--Dotted--Dashed--Ridge |
Legend border style |
Solid(solid) |
String |
Crosshair enable |
true--false |
Show/Hide crosshair |
true |
Boolean |
Line opacity |
|
Crosshair line opacity |
0.5 |
Number |
Tooltip enable |
true--false |
Show/Hide tooltip |
true |
Boolean |
Show tooltip group names |
true--false |
Show/Hide tooltip group names |
true |
Boolean |
Tooltip X data format |
|
X data format if timescale is selected |
DD MMM YYYY HH:mm |
String |
Tooltip font size■■ |
|
Tooltip font size in pixels |
10 |
Number |
Tooltip max width |
|
Max tooltip width in px |
250 |
Number |
Number of decimal points |
|
Number of decimal points that shows on the tooltip |
3 |
Number |
Tooltip find nearest number |
true--false |
Seek for the nearest point in the lines to show on the tooltip |
false |
Boolean |
Background color |
|
Background color of the entire element |
|
Color |
Graph background color |
|
Background color of the graph area |
|
Color |
Border |
true--false |
Show/Hide border |
false |
Boolean |
Border color |
|
Border color |
|
Color |
Border size |
|
Border width in pixels |
1 |
Number |
Border radius |
|
Border radius in pixels |
7 |
Number |
Shadow |
true--false |
Show/Hide shadow |
false |
Boolean |
Height |
100% of display height--90% of display height--80% of display height--70% of display height--60% of display height--50% of display height |
Height respect to the viewport |
100% of display height(100) |
String |
Minimum graph height |
|
Minimum graph height in pixels |
300 |
Number |
Min number of ticks |
|
Min number of ticks Not this will be automatically adjust from d3 library |
10 |
Number |
Remap to same axis size |
true--false |
If user have multiple groups(multiple x axes) turning this parameter on will help to have the same x bandwidth for all x axes |
true |
Boolean |
Visible■■ |
true--false |
Show/Hide component |
true |
Boolean |
■ - getParameter function available - getParameter function needs two input parameters, id and parameter name eg: getParameter('id of the component','parameter name')
■ - setParameter function available - setParameter function needs three input parameters, id, parameter name and the value eg: setParameter('id of the component','parameter name',value)
Trace Object
this object has 3 keys,
trace_list - user can define the line styles
Yaxis_list - user can define axis and styles
group list - user can define set of data assign to each lines. Assigning above defined trace styles and axis styles to the dataset is also done by this JSON object
All accepts JSON arrays, depend on the use case of showing values on the graph.
name - name of the trace(line). Accepting data type is string
color - color of the trace(line). Accepting data type is string(eg:"#000000")
style - trace(line) style. Accepting data type is string and options that can be use are limited to these "solid","dash","dot","dashdot"
width - trace(line) width in pixels
yLabel - name of the axis. Accepting data type is string
yLabelColor - color of the axis. Accepting data type is string(eg:"#000000")
yLabelSize - axis label font size in pixel. Note this will automatically change depend on the screen size as well
Yaxis_position - axis position that where to be appear in the graph "Left" or "Right"
group_list is where all the dataset defining and styles assign happens. This accepts JSON array. One JSON object need to have these details
name - name of the set of dataset assigned in a group(Categorized from the x axis)
scalertype - axis scaler type "scaleLinear" or "scaleTime". Use scale time to plot the graph in a data time format
line - List of datasets. Accept JSON array
start_range - If any value has mentioned here it will fixed the graph x axis to the given start range and end range. Otherwise for the specific x-axis start value and end value will automatically calculated from the dataset
end_range - If any value has mentioned here it will fixed the graph x axis to the given start range and end range. Otherwise for the specific x-axis start value and end value will automatically calculated from the dataset
line - this accept JSON array as well to add multiple lines in the graph. JSON keys under a single object as below.
value - JSON array of the dataset
Xvalue - list of Xvalues Note do not use this to update graph. Use value instead.
Yvalue - list of Yvalues Note do not use this to update graph. Use value instead.
trace - assign defined traces to a dataset by assigning trace_list name.
Yaxis - assign defined axises to a dataset by assigning Yaxis_list name.
marker - User can assign markers if want in to the trace(line). List of markers that accepts as follows - "none","circle","square","diamond","cross","x","triangle-up","triangle-down","triangle-right","triangle-left","star","y"
markerSize - size of the marker as a number
value - Value will accept two types of data depend on what was selected on the scalertype.
If scaletype is selected for scaleLinear value will accept JSON arrays. format will looks like this
"value": [
{ "x": 19, "y": 3 },
{ "x": 20, "y": 6 },
{ "x": 21, "y": 7 }
]
If scaletype is selected for scaleTime value will accept JSON arrays. format will looks like this
"value": [
{ "x": "2019-01-01T00:00:00", "y": "1" },
{ "x": "2019-01-01T00:01:00", "y": "2" },
{ "x": "2019-01-01T00:02:00", "y": "3" },
]
x data support for any String type Date which is able to pass through Date.parse function.
Example format of the JSON format for Trace Object:
{
"trace_list": [
{
"name": "Trace1",
"color": "#ff0000",
"style": "solid",
"width": "1.5"
}
],
"group_list": [
{
"name": "Graph",
"scalertype": "scaleLinear",
"line": [
{
"value": [
{ "x": 19, "y": 3 },
{ "x": 20, "y": 6 },
{ "x": 21,"y": 7}
],
"Xvalue": "[1,2,3]",
"Yvalue": "[1,2,3]",
"trace": "Trace1",
"Yaxis": "Axis1",
"marker": "none",
"markerSize": "0"
}
],
"start_range": "",
"end_range": ""
}
],
"Yaxis_list": [
{
"yLabel": "Axis1",
"yLabelColor": "#000000",
"yLabelSize": "16",
"Yaxis_position": "Left"
}
]
}
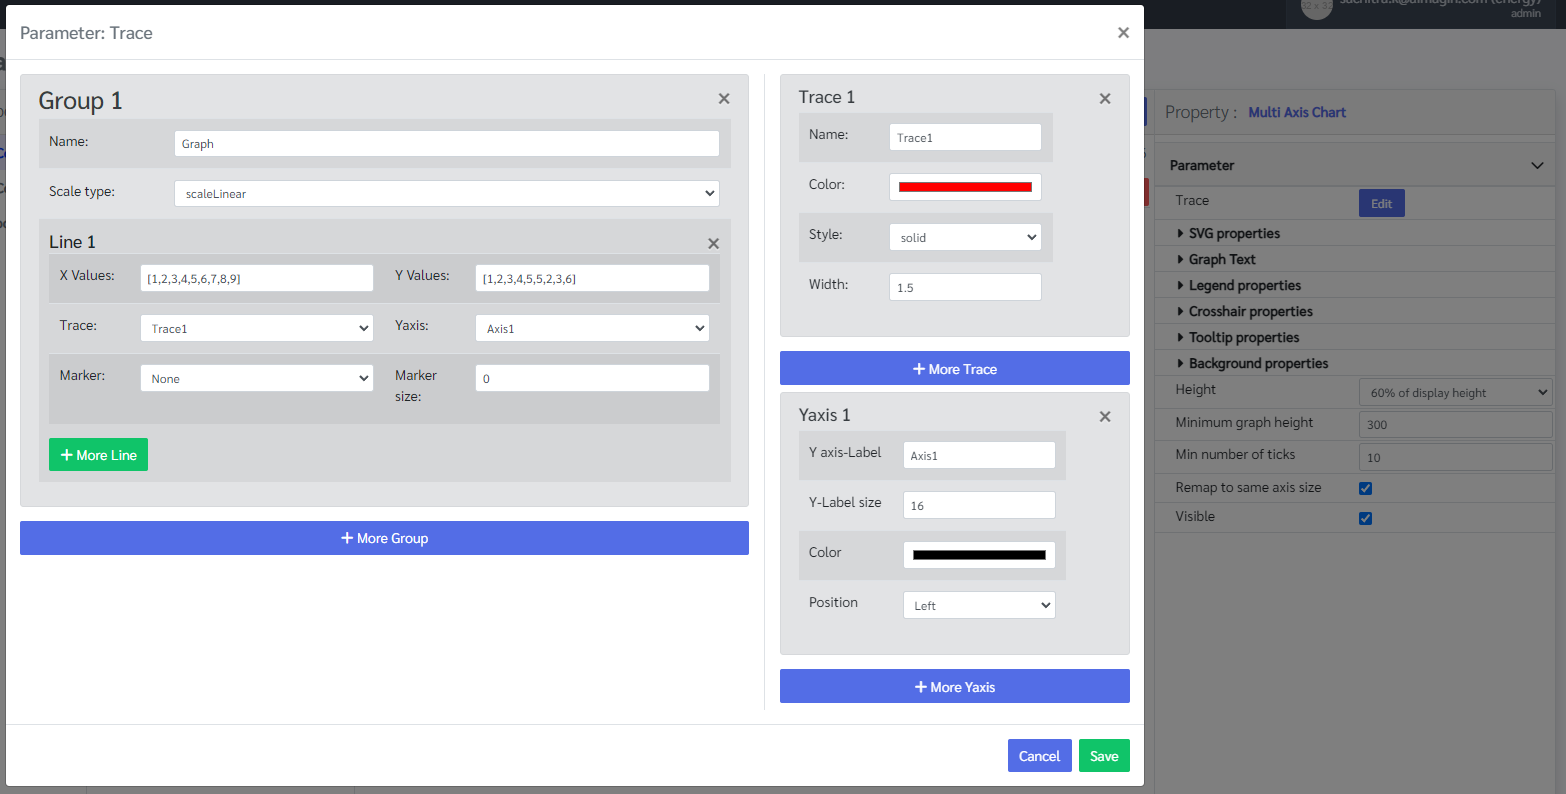
If the format is unclear user can always set some default values as described in the picture below and show it in the console window by using getParameter function.
When to use this component?
This component can be used to draw multi axis graph with many configurations.
How does this component work?
This component uses the D3 library to draw the graph and depending on the values that are in the Trace Object graph will be shown on the screen. Graphs also have functions like zooming, panning, and tooltip to show values on the graph.
Not if the graph has lots of data points it will automatically down sample the dataset to reduce the lag of loading the graph.